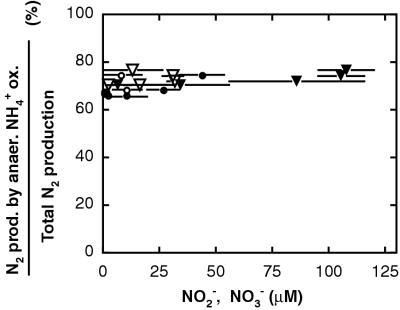
FIG. 4.
Relative contribution of anaerobic ammonium oxidation to total N2 production (anaerobic ammonium oxidation plus denitrification) as a function of the concentration of nitrate (filled symbols) or nitrite (open symbols) during two parallel experiments from Skagerrak S9 with the initial addition of 15N-nitrate to ∼50 nmol cm−3 (circles) and ∼100 nmol cm−3 (triangles). The different nitrate concentrations correspond to the consumption of the initial amendment, while nitrite concentrations reflect accumulation followed by depletion (Fig. 1). The contribution of anaerobic ammonium oxidation was calculated for each period between two consecutive samplings and is plotted as a function of the average concentration of nitrate or nitrite during the same period. Error bars indicate the concentration change between the consecutive samplings.

