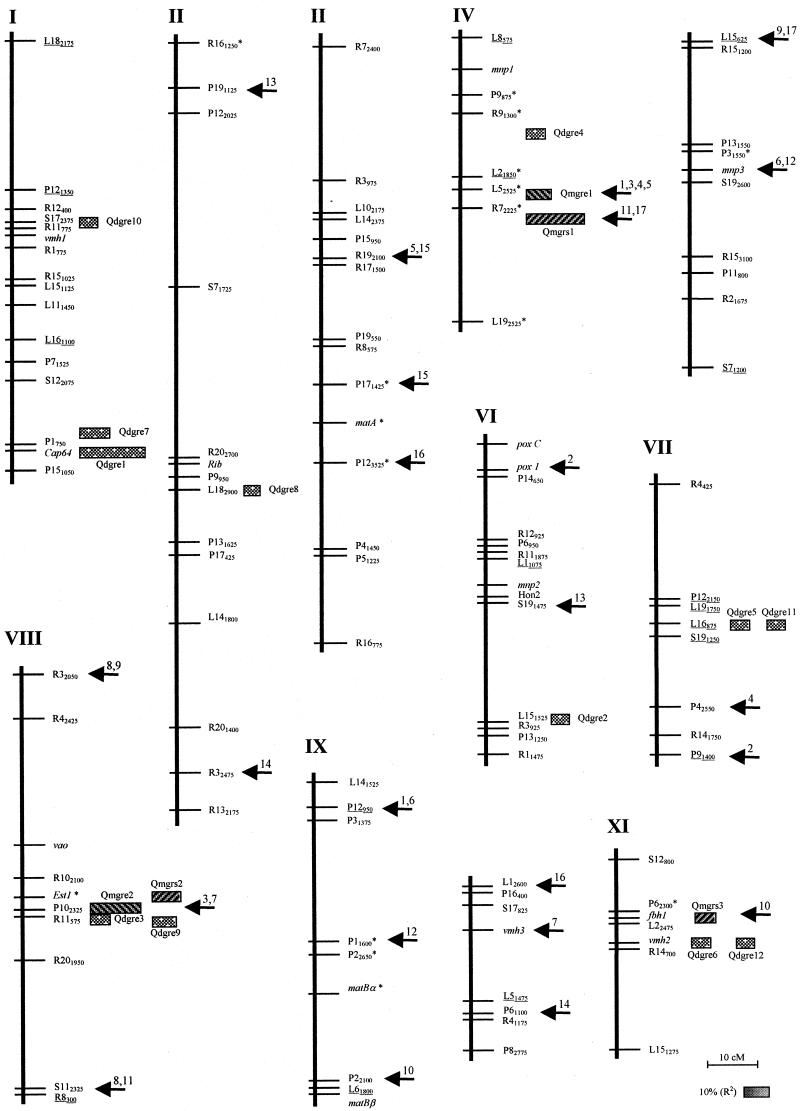
FIG. 1.
Linkage map of P. ostreatus (21) and locations of QTL and digenic interactions that affect vegetative growth rate in monokaryons and dikaryons. The approximate positions of QTLs are indicated to the right of the markers. The percentages of the phenotypic variation explained by the putative QTLs (R2) are represented by proportional boxes. Significant interactions among QTLs, genes, and other molecular markers are indicated by arrows and are numbered as shown in Table 3. Randomly amplified polymorphic DNA markers on the map are indicated by the primer name and the approximate length of the corresponding amplification product. Randomly amplified polymorphic markers converted to restriction fragment length polymorphism markers are underlined. Genes are in italics. Markers that deviated from the expected 1:1 segregation (P < 0.05) are indicated by asterisks.

