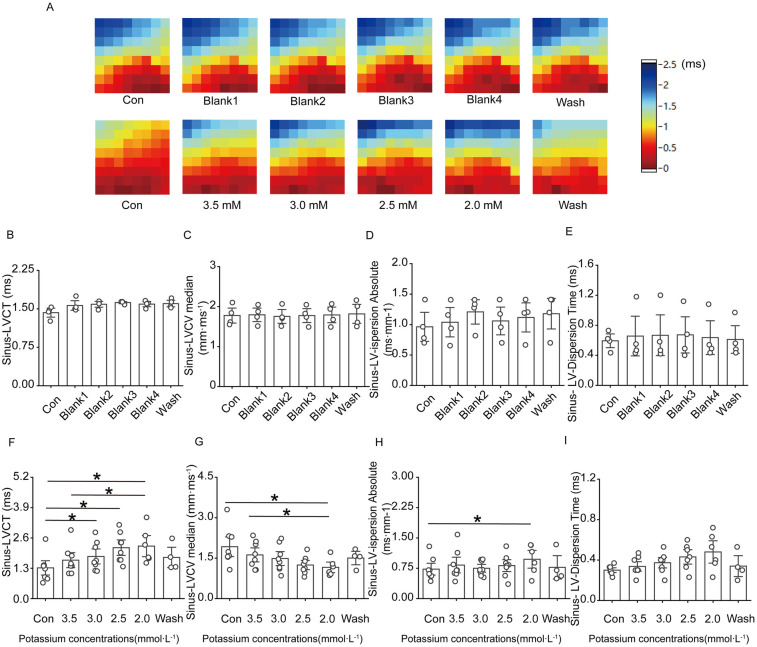
Figure 4.
Effect of low potassium perfusion on ventricular conduction in isolated rats in sinus rhythm. Sinus-LVCT is the left ventricular conduction time in sinus rhythm; Sinus-LVCV median is the left ventricular conduction velocity in sinus rhythm; Sinus-LV-dispersion absolute is the left ventricular conduction dispersion in sinus; Sinus-LV-Dispersion Time is the left ventricular conduction dispersion time in sinus rhythm. (A) Representative graphs of the left ventricular conduction thermogram changes in the control group and low-potassium-treated groups during the experiment in sinus rhythm; (B–E) Statistical graphs of LV conduction time, conduction velocity, conduction dispersion, conduction dispersion time in rats treated with K-H solution in sinus rhythm (n = 4); (F–I) Statistical graphs of LV conduction time, conduction velocity, conduction dispersion, and conduction dispersion time in rats treated with graded low-potassium solution in sinus rhythm (n = 8). *p < 0.05, **p < 0.01, ***p < 0.001.

