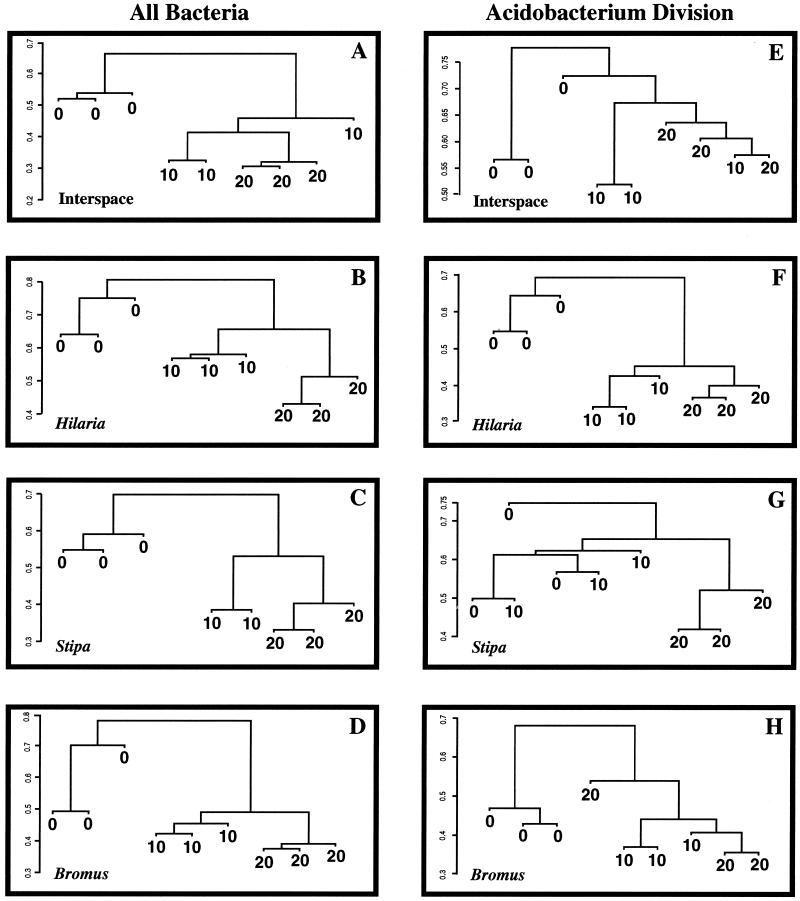
FIG. 3.
Relationships between soil bacterial communities at three depths in four different environments in an arid grassland, illustrated by UPGMA dendrograms generated from Jaccard distance matrices of TRF profiles. The y axis is the Jaccard distance measure. Panels A to D illustrate comparisons of the total bacterial community by PCR amplification of 16S rRNA genes from soil DNA using primers conserved for all bacteria, followed by generation of TRF profiles. Panels E to H illustrate a similar analysis that focused on the Acidobacterium division. Each branch on a tree represents a field sample comprised of three pooled soil cores and a combination of three technical replicate TRF profiles that were averaged as described in the text. Because of significant differences between communities associated with the different grass species, comparisons between soil depths are confined to a single plant species or the interspace. In the figure, 0, 10, and 20 represent soil from a depth of 0 to 10, 10 to 20, and 20 to 30 cm, respectively. For the total bacterial community comparison, one of the Stipa samples at a depth of 10 to 20 cm was lost during processing and is missing from the figure.

