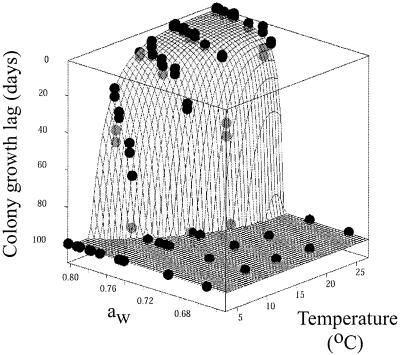
FIG. 2.
Observed colony growth lags (D+ and D−) of W. sebi in syrup agar as a function of temperature and aw. The lower and upper points for each data pair represent the D+ and D− values, respectively. The fit surface of the secondary growth model describing the predicted colony growth lags (equation 2) is represented by a slightly opaque grid; the data points in front of the grid are indicated by black circles, and the data points behind the grid are indicated by gray circles. For illustrative purposes, observed and predicted colony growth lags greater than 100 days are expressed as 100 days.

