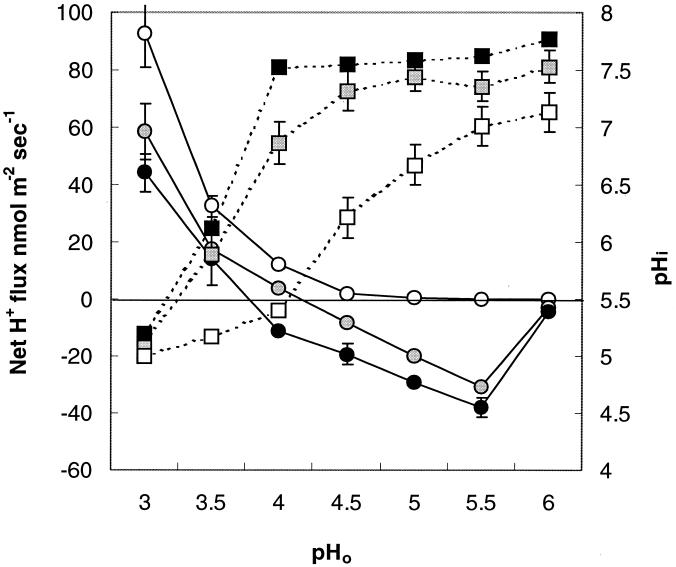
FIG. 3.
Net H+ fluxes (circles) and pHi (squares) as functions of pHo (static experiments). Cells were adapted for 1 h in a pHo range between 3.0 and 6.0 at 0.5-pH unit intervals at three levels of glucose in MM before measurement. Open symbols, 0 mM glucose; shaded symbols, 1 mM glucose; solid symbols, 10 mM glucose. The pHi values are averages of 40 to 60 single cells; the net H+ flux values are averages of three to six independent experiments with four to six distinct areas of immobilized cells measured in each. The error bars indicate standard errors of the mean.

