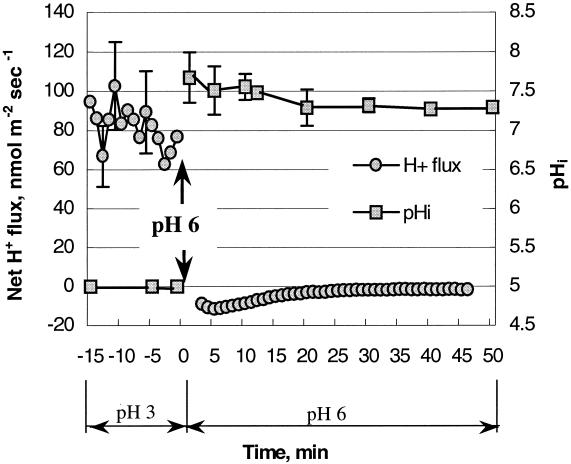
FIG. 6.
Kinetics of recovery measured as pHi and net H+ flux changes at pHo 6.0 after an acid stress at pH 3.0. The change of pHo from 3 to 6 is indicated by the arrow. The medium contained 1 mM glucose for all of the treatments; 20 individual cells were monitored for pHi analyses. The error bars indicate standard errors of the mean (n = 3).

