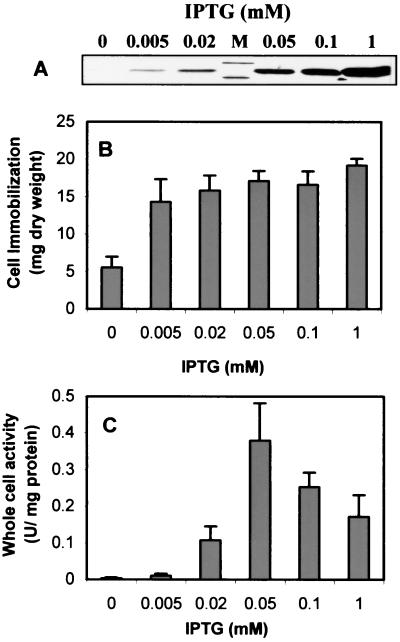
FIG. 5.
(A) Expression levels of Lpp-OmpA-CBD at increasing concentrations of IPTG. Total proteins were probed with anti-CBD serum as described in the legend to Fig. 1. (B) Binding capacities of XL1-Blue/pUCBD/pPNCO33 cells under different levels of induction. The amount of cells immobilized is expressed in milligrams of cells (dry weight) per support. (C) Whole-cell activities of XL1-Blue/pUCBD/pPNCO33 under different levels of induction. Data are mean values ± standard deviations from four experiments.

