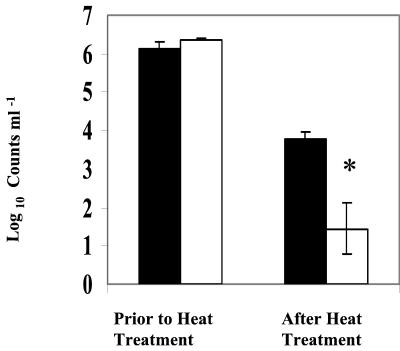
FIG. 3.
Comparison of CFU and GFP-based total counts of E. coli in pasteurized and unpasteurized milk. The asterisk indicates a significant (P < 0.05) difference. Error bars, standard errors of the means of three replicates. UHT milk was inoculated with gfp-tagged E. coli (2.5 × 10⁶ ml−1) and heat treated (63°C for 30 min) before analysis. GFP-based viable counts were measured by epifluorescence microscopy. Solid bars, numbers of GFP-expressing cells per milliliter; open bars, numbers of CFU per milliliter.

