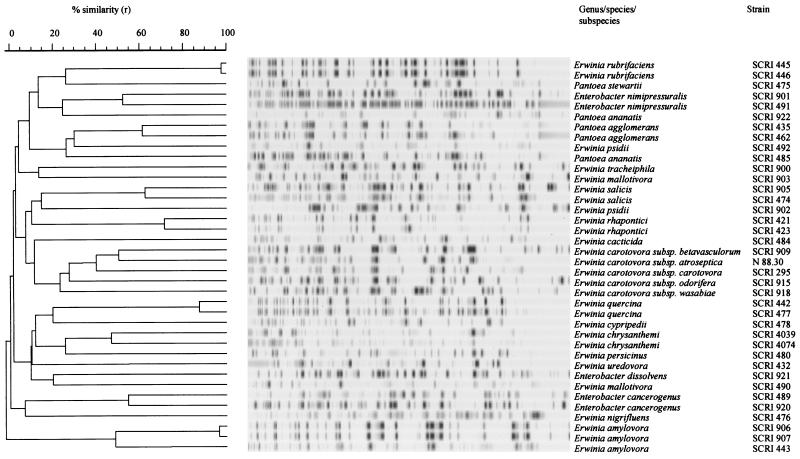
FIG. 1.
Dendrogram derived from the UPGMA linkage of correlation coefficients between AFLP profiles from soft rot erwinias, and other erwinias and enterobacterial species. The levels of linkage representing the Pearson product-moment correlation coefficient (r) are expressed as percentages for convenience. The banding profiles against each branch represent normalized and background-subtracted digitized gel strips processed in GelCompar.

