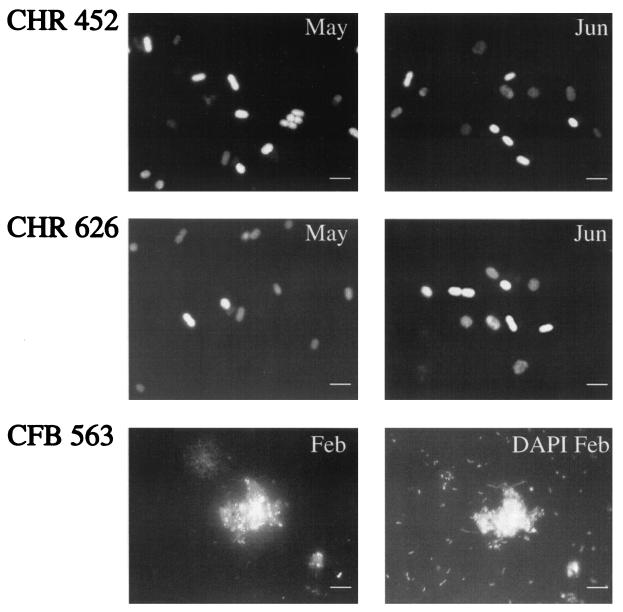
FIG. 4.
FISH analysis with specific probes for both Thiocystis spp. (CHR-452 and CHR-626; upper and middle panels, respectively) and one Cytophaga sp. (CFB563, lower panels). Bars, 5 μm. Positive Thiocystis cells appear white; autofluorescent negative cells of Thiocystis appear gray. Cytophagas are shown to correspond to the DAPI-stained cells attached to particles.

