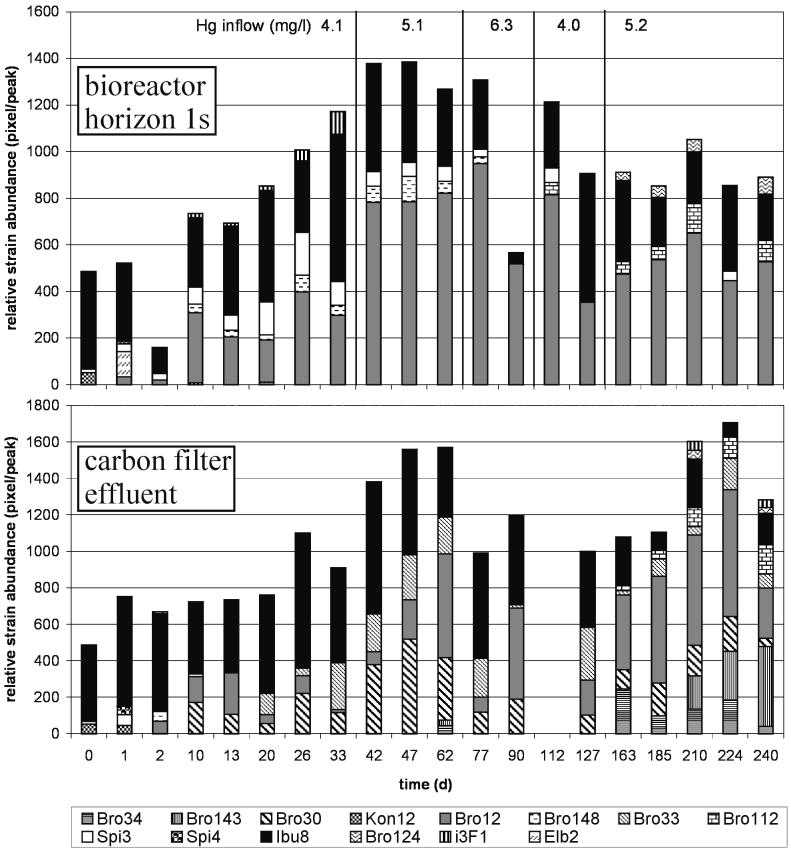
FIG. 3.
Time course of relative strain abundance in the bioreactor biofilm near the inflow and in the carbon filter effluent. The relative abundance of the strains based on the intensity of the diagnostic band of each strain within the community fingerprint in relation to the size marker intensity is shown. Data of the carbon filter community at day 112 are missing due to a failure of electrophoretic separation.

