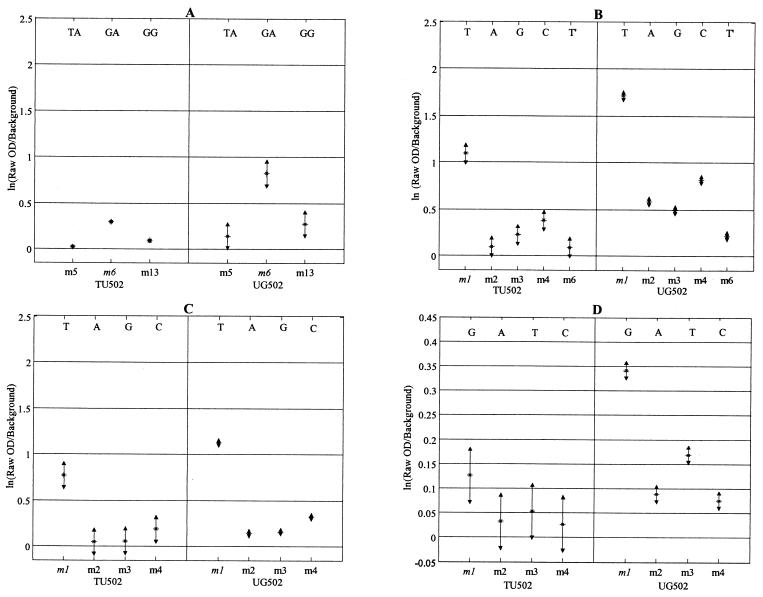
FIG. 2.
Detection of SNPs at selected diagnostic positions for genotype I isolates TU502 and UG502. The letters above the probe positions indicate the polymorphic nucleotides for each probe combination. Probes in italics are the perfectly matched probes for genotype I isolates (see Table 1 for the complete probe sequences). Results were based on a minimum of two replicates for each isolate. Error bars represent ±2 standard errors of the mean. All hybridizations were conducted by using the Cy3 labeling strategy and overnight hybridization at 4°C. (A) Positions 1368 and 1371. For clarity, only the probes with the three greatest values are shown. (B) Position 1404. T′ is a single-base-pair mismatch between the genotype II probe, m4, and the probe for C. felis. This polymorphism occurs at position 1398 (numbering based on GenBank accession number AF221535). (C) Position 1533. (D) Position 1542. OD, optical density.

