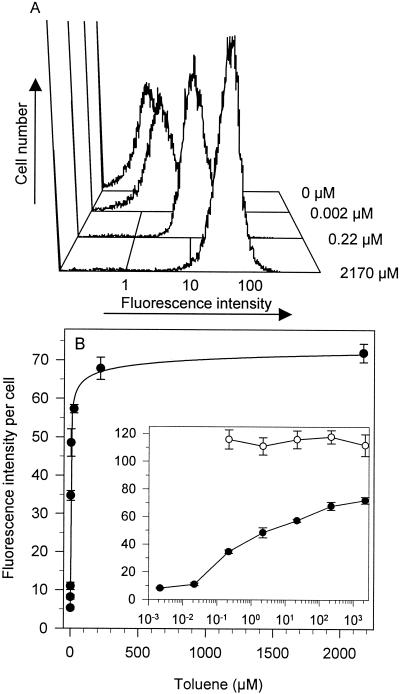
FIG. 4.
Flow cytometric analysis of fluorescence intensity of individual cells of P. fluorescens A506(pTS) exposed to toluene. Cultures were exposed to various toluene concentrations, incubated for 3 h, and analyzed by flow cytometry as described in Materials and Methods. (A) Representative histograms showing the distribution of fluorescence intensity per cell upon exposure to 0, 0.002, 0.22, or 2,170 μM toluene. Fluorescence intensity is on a log scale. The y axis is the number of fluorescent cells detected. (B) Mean fluorescence intensity of P. fluorescens A506(pTS) (•) and A506(pPnptII-gfp) (○) exposed to various toluene concentrations. The line represents a nonlinear best fit of the data to the hyperbolic equation y = ymax − {(ymax − ymin)/(1 + K1/2 × [toluene]1/d}, where y is the fluorescence response at a given toluene concentration, ymax is the fluorescence response at saturating concentrations of toluene, ymin is the fluorescence response at 0 μM toluene, K1/2 is the concentration of toluene at which the half-maximal effect is observed, and d is the hyperbolic coefficient (d = 5.2 ± 1.6). The inset shows the same data, but it is plotted on a log10 toluene concentration scale. The regression equation for 0.002 to 2,170 μM toluene is y = {11.71 × (log10 [toluene])} + 38.8; r2 = 0.96. Points represent the means ± standard errors of the means of 3 to 5 replications.

