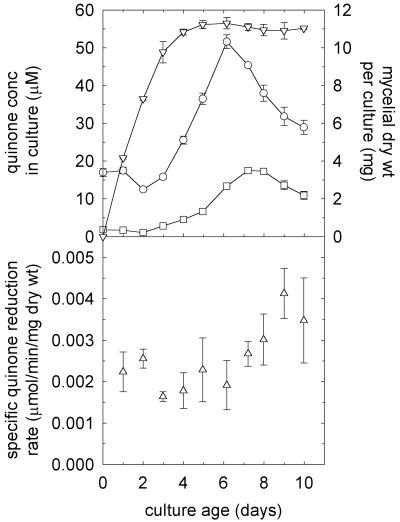
FIG. 1.
Production and reduction of quinones by G. trabeum. The top panel shows the average extracellular concentration of 2,5-DMBQ in each culture (○), the average extracellular concentration of 4,5-DMBQ in each culture (□), and the average dry weight of mycelium in each culture (▿). The error bars show the standard deviations for triplicate determinations. Quinones were detected on day zero in this experiment because they were already present in the agar plate inoculum (see Materials and Methods). The bottom panel shows the average rate of 2,6-DMBQ reduction per milligram (dry weight) of mycelium by three harvested and pooled mycelial mats (see Materials and Methods). The error bars show the standard deviations for triplicate determinations. In an additional experiment, we found that the specific rate of 2,5-DMBQ reduction on day 7 was 0.0027 U/mg (dry weight), the same as the rate of 2,6-DMBQ reduction.

