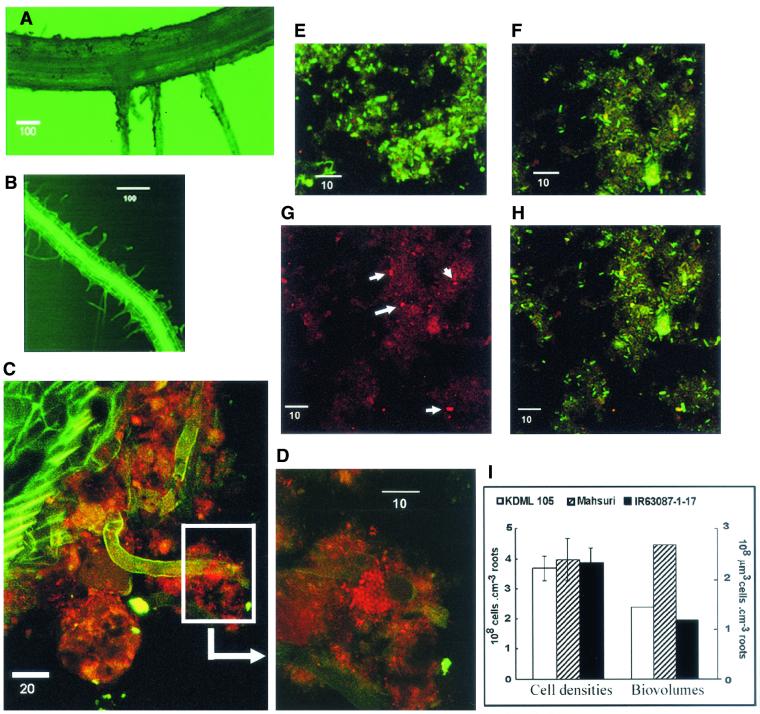
FIG. 4.
CLSM images of rice roots and root surface biofilm samples. (A) Rice root before sonication; (B) rice root after sonication; (C) biofilm situated on root surface; (D) close-up of boxed region in C. (E to H) Root biofilm samples detached from root surface by sonication: Mahsuri biofilm (E), IR63087-1-17 biofilm (F), and biofilm showing stained AOB (G). (H) Same image as in panel G, but showing all bacterial cells stained by probes Eub338 (green) and Nsm156 (red). Colocalization of probes produces a yellow color. (I) Total cell abundance expressed as cell densities and biovolumes. Error bars indicate 95% confidence intervals. Scale bars in CLSM images are in units of micrometers.

