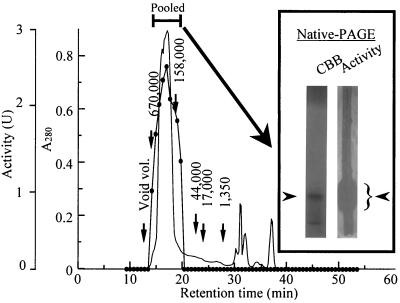
FIG. 3.
Gel filtration chromatography of SAP with Protein KW-803 and the native PAGE profile. SAP (3 mg) was applied to the column (diameter, 0.8; length, 30 cm) and was eluted with 10 mM Tris-HCl buffer (pH 7.5) at a flow rate of 0.5 ml/min. The solid circles indicate anti-Pythium activity, and the line without circles shows the absorbance at 280 nm. The numbers above the vertical arrows indicate the retention times of the molecular mass standards eluted in the same column. The active fractions were subjected to native PAGE and were stained with Coomassie brilliant blue (CBB) or visualized on an agar plate with precultured P. porphyrae (Activity). The fungal growth on the agar plate is evident in the white border on either side of the native PAGE gel on the right. The arrowheads next to the native PAGE gels indicate the positions of SAP (left gel) and anti-Pythium activity (right gel).

