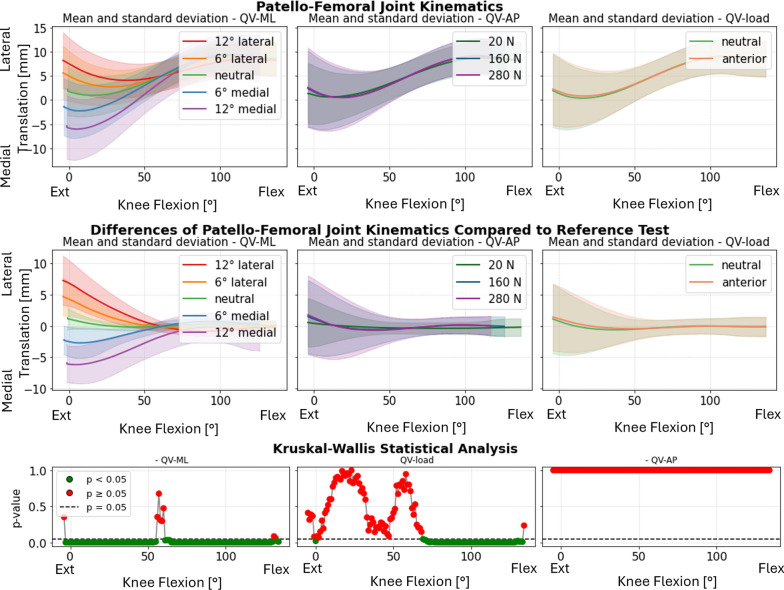
Fig. 6.
Medial–lateral translation of the patella. Top: absolute values as a function of knee flexion angle (the median and standard deviation between 12 specimens are plotted). Center: differences of all tests compared with the reference test (QVload = 20 N, QVML = neutral, and QVAP = posterior). Left shows the difference as a function of QVML, middle QVload, and right QVAP. Bottom: significance of the differences plotted at the center. The p-value trend is plotted for the three parameters (left QVML, middle QVload, and right QVAP); the significant values are highlighted in green (p < 0.05) and the nonsignificant ones in red (p ≥ 0.05)

