

Abstract
Background
The Metabolic Score for Insulin Resistance (METS-IR) is a novel biomarker for evaluation of insulin resistance (IR). Emerging evidence suggests this metric may be able to predict the onset of metabolic syndrome (MetS). The aim of this study was to determine whether there is a correlation between sustained METS-IR values and the future risk of MetS.
Methods
Data for 3,750 individuals who attended a tertiary hospital in Zhengzhou for a health check-up between 2017 and 2022 were analyzed. The METS-IR was used to evaluate IR. A latent class trajectory model was created by dividing the subjects into high-stability and low-stability categories based on three consecutive years of data. The incidence of MetS between 2020 and 2022 was calculated using the Kaplan–Meier method and Cox regression modeling.
Results
Over a median follow-up of 2.13 years, we identified 430 cases of MetS (11.47%). The incidence rate was 35.48% in the high-stability group and 8.32% in the low-stability group (P < 0.001). Multivariate Cox regression, controlling for sex, age, hypertension status, diabetes status, and serum uric acid, low-density lipoprotein cholesterol, and gamma-glutamyl transferase levels, revealed that the risk of MetS was significantly higher in the high-stability group (hazard ratio [HR] = 4.77, 95% confidence interval [CI]: 3.714–6.126, P < 0.001). Stratified analysis by age showed that the risk of MetS was also significantly higher in individuals aged < 45 years (HR = 6.202, 95% CI: 4.312–8.921) and in those aged ≥ 45 years (HR = 3.89, 95% CI: 2.720–5.566) in the high-stability group. Receiver operating characteristic (ROC) curve analysis showed that the trajectory of METS-IR could predict MetS. The respective areas under the ROC curve for the 1-year, 2-year, and 3-year risk of MetS were 0.575, 0.641, and 0.628. Sensitivity analyses showed that an elevated METS-IR value was associated with an increased risk of new-onset MetS.
Conclusions
In this study, there was a significant correlation between the METS-IR value and the future risk of MetS. METS-IR measurement over time may allow early detection of individuals at high risk of MetS, which would lessen the impact of chronic disease.
Supplementary Information
The online version contains supplementary material available at 10.1186/s12944-025-02690-8.
Keywords: Insulin resistance, Metabolic syndrome, Cohort study, Risk factors
Introduction
Metabolic syndrome (MetS) has become increasingly prevalent worldwide because of increases in the frequency of risk factors, which include abdominal obesity, hypertension, elevated glucose, a high triglyceride (TG) concentration, and a low high-density lipoprotein cholesterol (HDL-C) level [1–3]. MetS is also a pathological state that involves a series of interrelated metabolic abnormalities that increase the risk of diabetes, cardiovascular disease (CVD), and certain types of cancer [4]. Insulin resistance (IR) is a metabolic abnormality that occurs when the body’s cells become less responsive to insulin, interfering with appropriate glucose absorption and metabolism, and is closely associated with numerous health complications [5–8].
IR has been reported to lead to impaired insulin signaling, potentially causing disorders of lipid metabolism as well as increased inflammation and oxidative stress. These changes can impair glucose regulation, leading to hyperglycemia and hyperinsulinemia, which in turn affect the distribution of fat and metabolic processes, thereby increasing the risk of MetS [9–11]. The metabolic score for IR (METS-IR) gauges the intensity of IR levels [12–14], whereas the homeostatic model assessment of IR (HOMA-IR) index is also an important indicator of IR [15]. However, this study selected METS-IR rather than HOMA-IR as the primary indicator of IR because METS-IR integrates various metabolic parameters, including blood lipids and blood pressure. METS-IR also allows a broader assessment of metabolic function and can assess the relationship between IR and MetS more accurately than HOMA-IR [4]. Moreover, HOMA-IR primarily focuses on basal IR, whereas METS-IR focuses on the characteristics of IR in the context of MetS. Given that this study focuses on the context of MetS, METS-IR can be considered more targeted [16, 17]. Several recently published studies have explored the relationship between METS-IR and MetS. Safaei et al. have demonstrated that a METS-IR value of ≥ 46.53 can be used to diagnose MetS, and outperforms homeostasis model assessment for adiponectin (HOMA-AD) for identification of MetS [4]. Furthermore, a study of the roles of adiponectin, HOMA-AD, and HOMA-IR in explaining metabolic complications in 691 Brazilian children and adolescents with various body mass index (BMI) categories by Cândido et al. showed that the predictive value of adiponectin is much lower than that of HOMA-AD and HOMA-IR [18]. These studies also demonstrated that METS-IR is a more effective predictor of future onset of MetS.
The relationship between METS-IR and MetS has already been explored in detail. However, the studies reported to date have been cross-sectional and have not established a causal relationship between METS-IR and MetS. Furthermore, there has been limited research on the link between IR and progression of MetS over time. The aims of this cohort study were to explore whether long-term IR can trigger MetS, clarify how fluctuating IR influences the onset and progression of MetS, and provide novel insights into the mechanisms underlying MetS.
Methods
Study population
This study analyzed health check-up data collected from a tertiary hospital in Zhengzhou between January 2017 and December 2022. In total, 35,078 individuals attended for health assessments during this period. Basic demographic, anthropometric, and biochemical test data were collected. After the exclusion of subjects who were diagnosed with MetS before 2020 (n = 5,453), those who missed three consecutive years of health check-ups (n = 24,967), and those without the necessary information for calculation of the METS-IR value (n = 243), 4,415 subjects remained eligible. Subsequently, 479 further individuals were excluded for not having attended for health check-ups or having incomplete study information during the follow-up period, as were 186 with diseases such as pancreatic disorder, hepatitis, biliary tract disease, malignancy, severe hepatic or renal insufficiency, and severe infection. Finally, 3,750 subjects were included in the study (Figure S1). The study was approved by the Ethics Board of Zhengzhou University’s First Affiliated Hospital (approval number 2018-KY-56). All subjects consented to inclusion of their data in the study.
Questionnaire survey
All study subjects were required to complete a standardized health examination questionnaire (at the end of Supplementary). The questionnaire demonstrated satisfactory reliability and validity, with an overall Cronbach’s alpha of 0.79. The content validity analysis yielded robust results, showing content validity coefficients between 0.80 and 1.00 at the item level and a coefficient of 0.91 at the scale level, all of which surpassed the established acceptability criterion of 0.80 for psychometric instruments. Healthcare professionals interviewed participants in person and filled out the questionnaires accordingly. The demographic information was incorporated into the questionnaire. Current smokers and drinkers were divided into Yes and No [19]. The questionnaire also assessed each participant’s use of medication for, and medical history of, hypertension, diabetes, and dyslipidemia.
Anthropometric measurements
During the health examinations, clinicians used standardized instruments to precisely assess height, weight, blood pressure, and waist circumference (WC). An SK-X80 stadiometer (Shenzhen Sonka Electronic Technologies Limited, Shenzhen, China) was used to measure height and weight. Participants were required to be barefoot, with no head covering, and dressed in light clothing at the time of these measurements. BMI was calculated according to the measured height and weight values. An electronic HBP-9021 sphygmomanometer (Omron Dalian Co., Ltd., Dalian, China) was used to measure blood pressure. The subjects were instructed to avoid alcohol, caffeine, and vigorous physical activity before blood pressure was measured. They were asked to sit with the upper arm on which blood pressure was to be measured at chest level and relax for five minutes, after which blood pressure was measured on three consecutive occasions with a two-minute interval between each measurement. The mean of the three measurements was recorded. When measuring WC, the subject was asked to stand upright and breathe in a normal manner. A measuring tape was gently wrapped around the abdomen at precisely 1 cm above the navel, and the measurer ensured no skin compression. WC was measured twice, and the average of the two measurements was recorded [20].
Laboratory tests
Venous blood samples were drawn in the morning after an overnight fast. An automated Cobas-8000 biochemical analyzer (Roche Diagnostics, Mannheim, Germany) was used to measure various biochemical indicators. The indicators chosen were fasting plasma glucose (FPG), total cholesterol (TC), TGs, HDL-C, low-density lipoprotein cholesterol (LDL-C), serum uric acid (SUA), estimated glomerular filtration rate (eGFR), alanine aminotransferase (ALT), aspartate aminotransferase (AST), gamma-glutamyl transferase (GGT), serum creatinine (Scr), and glycated hemoglobin (HbA1c). The following biomarkers were analyzed using standardized laboratory techniques: FPG by hexokinase assay, Scr by enzymatic colorimetry, SUA by uricase colorimetry, and AST/ALT/GGT using kinetic rate methodology. The HbA1c level was quantified by ion-exchange high-pressure liquid chromatography, with the lipid panel components TC, TG, HDL-C, and LDL-C assessed via cholesterol oxidase, enzymatic method, PEG-modified enzyme, and surfactant clearance methods, respectively. The following formula was used to calculate eGFR:
 |
 |
 |
 |
Definitions of disease
Hypertension was defined as systolic blood pressure (SBP) ≥ 140 mmHg and/or diastolic blood pressure (DBP) ≥ 90 mmHg, based on three measurements of blood pressure on separate days in the clinic, a history of hypertension, or use of antihypertensive medication [21]. Dyslipidemia was diagnosed if any of the following conditions applied: TGs ≥ 1.7 mmol/L; TC ≥ 5.2 mmol/L; LDL-C ≥ 3.4 mmol/L; HDL-C < 1.0 mmol/L [22]; or a past history of hyperlipidemia or use of antihyperlipidemic medications. Diabetes was diagnosed if HbA1c was ≥ 6.5%, FPG was ≥ 7.0 mmol/L, there was a history of diabetes, or the subject was on antidiabetic medication [23].
Definition and calculation of METS-IR
The METS-IR is a non-insulin-dependent metabolic index used to assess IR [24, 25]. It evaluates the degree of IR in an individual by combining basic biochemical test results and anthropometric measurements without the need to directly measure insulin levels. The METS-IR value is calculated using the following formula:
METS-IR = ln [2 × FPG (mg/dL) + TG (mg/dL)] × BMI (kg/m2)/ln [HDL-C (mg/dL)]
Definition of MetS
An individual must meet at least three of the following criteria to be diagnosed with MetS: abdominal obesity (a WC of ≥ 90 cm in men or ≥ 80 cm in women [consistent with Asian population standards]); elevated blood glucose (FPG ≥ 6.1 mmol/L, a two-hour post-load glucose of ≥ 7.8 mmol/L, or a pre-existing diagnosis of diabetes with ongoing treatment); hypertension (blood pressure readings of ≥ 130/85 mmHg [where 1 mmHg equals 0.133 kPa] or a confirmed diagnosis of hypertension with ongoing management); hypertriglyceridemia (fasting TG level ≥ 1.70 mmol/L); and low HDL-C (< 1.04 mmol/L in men or < 1.30 mmol/L in women) [26].
Quality control
Standardized questionnaires
The study used a standardized epidemiological survey form with detailed instructions for its completion, to ensure that all information collected was consistent and accurately recorded.
Unified training
All medical staff and laboratory technicians involved in the health check-ups received standardized training to ensure familiarity with and strict adherence to the health check-up protocols.
Consistent equipment and reagents
The same models of equipment and standardized reagents were used for all examinations and tests. This practice was essential for ensuring the consistency and comparability of the results obtained from all subjects.
Equipment calibration and method standardization
Regular calibration of equipment and standardization of testing methods were implemented to ensure consistency of results.
Supervision by quality control officers
Specialist quality control officers were appointed to oversee each batch of health check-ups. Their role was to ensure that all procedures were performed in a standardized manner and that the results obtained were accurate and reliable.
Statistical analysis
The ideal METS-IR trajectory count (2–5) and form (linear, quadratic, cubic) were determined using the Akaike information criterion (AIC), Bayesian information criterion (BIC), entropy, the proportion of participants, and average posterior probability of assignment (APPA) [27]. The Kolmogorov–Smirnov test was used to assess whether the continuous data followed a normal distribution. The Mann–Whitney U test was applied for continuous variables that did not meet the assumptions of normality. The chi-squared test was used to examine differences in categorical data among groups. During the clinical examinations, study subjects may have undergone check-ups at various institutions or hospitals, which could lead to discontinuity in their physical examination data and, consequently, missing values (Figure S2). To address these missing values, we used multiple imputation methods (the mice package in R) for data filling; continuous data were filled using the random forest method and binary data were filled using the least absolute shrinkage and selection operator regression for feature selection and logistic regression for filling of missing values. The incidence of MetS across both groups was estimated using the Kaplan–Meier method, and the log-rank test was used to assess differences in the incidence curves for MetS across distinct METS-IR trajectory groups. The latent class trajectory model tools in the R package were used to fit the specified latent class trajectory models. The following Cox proportional hazards models were used to assess the likelihood of developing MetS: model 1 (unadjusted); model 2 (addition of sex and age); model 3 (addition of hypertension and diabetes); and model 4 (further adjusted for GGT, SUA, and LDL-C based on model 3). Comprehensive diagnostic tests to validate the proportional hazards assumption of the Cox model were performed using the Survminer and Survival packages in R version 4.2.3. The Schoenfeld residuals test indicated no significant time-dependent trends overall, except for age (all other variables: P > 0.05, Figure S3). Given the violation detected for age (P = 0.0056), we performed a stratified analysis by age. A nomogram was constructed using the results from the Cox regression analysis to depict the influence of individual variables. Receiver operating characteristic (ROC) curves were used to assess the prediction performance of METS-IR two-category trajectory groupings for MetS. The ability of the three-year average of the METS-IR values to predict MetS was also assessed. Three sensitivity analyses were performed: one after exclusion of subjects with missing data, one after exclusion of subjects who were diagnosed with MetS within a year after the initial assessment, and one after classifying the METS-IR trajectory into three groups. All statistical analyses were performed using SPSS version 25.0 (IBM Corp., Armonk, NY, USA) and R version 4.2.3 (R Foundation for Statistical Computing, Vienna, Austria). The threshold for statistical significance was α = 0.05.
Results
METS-IR trajectory grouping
The trajectory analysis of METS-IR was conducted based on the health check-up data between 2017 and 2019. Two distinct trajectory groups were identified, namely, low-stability and high-stability groups. The AIC, BIC, and entropy values were 59,034, 59,096, and 788.119, respectively, and the APPA values for the two groups were 84.11% and 66.25%, respectively (Table S1 ). The low-stability group included 3316 subjects (88.43%), with a mean METS-IR value fluctuating between 32.28 and 32.93. The METS-IR values remained relatively low and stable in this group during the study period. The high-stability group included 434 subjects (11.57%), with a mean METS-IR value fluctuating between 42.31 and 43.06. The METS-IR values in this group remained stable at a relatively high level (Fig. 1).
Fig. 1.
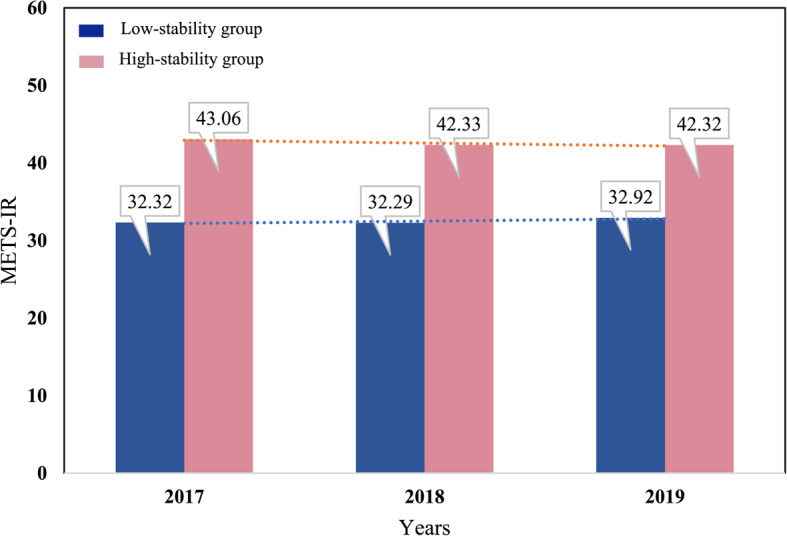
METS-IR trajectory groups in a population that attended for health check-ups between 2017 and 2019. The blue and pink bars represent the low-stability and high-stability groups, respectively. Values on the bars indicate the METS-IR level for each group in the corresponding year. METS-IR, Metabolic Score for Insulin Resistance
Three trajectory groups (low-stability, medium-stability, and high-stability) were included in the sensitivity analysis (Table S1 ), and the three-class linear model had AIC and BIC values of 59,024 and 59,099. The APPA values corresponding to the three groups were 81.63%, 80.76%, and 76.58%, respectively.
Study population characteristics at baseline
The baseline data for this study were derived from the health check-up records of 2019, comprising a total of 3,750 participants. The proportion of women was relatively high, comprising 2,246 (59.89%) of the total, and the high-stability group was slightly younger. Specifically, values for the average METS-IR value, WC, SBP, DBP, BMI, ALT, AST, GGT, Scr, SUA, TG, LDL-C, and FPG were markedly higher in the high-stability group than in the low-stability group. The high-stability group also had considerably higher rates of smoking, alcohol consumption, and MetS. Conversely, the high-stability group had notably lower HDL-C levels. There were no meaningful variations in eGFR, TC, or HbA1c levels. Similarly, there were no statistically significant between-group differences in participants' histories of hypertension, diabetes, or hyperlipidemia or in the prevalence of use of related medications, including antihypertensive agents, glucose-lowering treatments, and drugs for cholesterol management (Table 1).
Table 1.
Baseline demographic and clinical data according to METS-IR trajectory group
| Indicators | Total N=3750 |
Low-stability Group
N=3316 |
High-stability Group
N=434 |
Z/χ² | P |
|---|---|---|---|---|---|
| Number of cases (Male/Female) | 1504/2246 | 1447/1869 | 57/377 | 148.65 | <0.001 |
| Age [years,M (Q1,Q3)] | 46.00 (35.00, 55.00) | 46.00 (35.00, 56.00) | 42.00 (35.00, 54.00) | -2.49 | 0.013 |
| Avg METS-IR [M (Q1, Q3)] | 33.56 (29.92, 37.25) | 32.74 (29.44, 35.96) | 41.93 (40.71, 43.78) | -33.62 | <0.001 |
| WC [cm, M (Q1, Q3)] | 82.00 (76.00, 88.00) | 81.00 (75.00, 87.00) | 90.00 (87.00, 96.00) | -22.71 | <0.001 |
| SBP [mmHg, M (Q1, Q3)] | 119.00 (109.00, 130.00) | 118.00 (109.00, 130.00) | 120.00 (112.00, 129.00) | -2.07 | 0.038 |
| DBP [mmHg, M (Q1, Q3)] | 73.00 (66.00, 80.00) | 72.00 (66.00, 80.00) | 75.00 (70.00, 81.25) | -5.33 | <0.001 |
| BMI [kg/m², M (Q1, Q3)] | 23.74 (21.85, 25.53) | 23.34 (21.63, 24.93) | 27.52 (25.97, 29.04) | -28.08 | <0.001 |
| ALT [U/L, M (Q1, Q3)] | 16.00 (12.00, 23.00) | 16.00 (12.00, 22.00) | 21.00 (16.00, 30.00) | -11.91 | <0.001 |
| AST [U/L, M (Q1, Q3)] | 20.00 (17.00, 23.00) | 19.00 (17.00, 23.00) | 21.00 (18.00, 25.00) | -4.85 | <0.001 |
| GGT [U/L, M (Q1, Q3)] | 17.00 (12.00, 26.00) | 17.00 (12.00, 24.00) | 26.00 (18.00, 37.00) | -13.33 | <0.001 |
| Scr [μmol/L, M (Q1, Q3)] | 73.00 (62.00, 83.00) | 71.00 (61.00, 82.00) | 79.00 (69.75, 86.00) | -8.70 | <0.001 |
| SUA [μmol/L, M (Q1, Q3)] | 314.00 (260.00, 371.00) | 306.00 (254.00, 361.00) | 374.50 (318.00, 420.00) | -14.69 | <0.001 |
| eGFR [ml/ (min*1.73m², M (Q1, Q3)] | 101.49 (90.37, 110.64) | 101.58 (90.21, 110.69) | 100.97 (91.77, 109.90) | -0.02 | 0.986 |
| TC [mmol/L, M (Q1, Q3)] | 4.55 (4.01, 5.14) | 4.56 (4.01, 5.14) | 4.52 (4.00, 5.12) | -0.62 | 0.537 |
| TG [mmol/L, M (Q1, Q3)] | 1.07 (0.81, 1.49) | 1.04 (0.78, 1.43) | 1.43 (1.08, 1.99) | -13.28 | <0.001 |
| HDL-C [mmol/L, M (Q1, Q3)] | 1.40 (1.21, 1.64) | 1.44 (1.24, 1.67) | 1.18 (1.04, 1.35) | -17.78 | <0.001 |
| LDL-C [mmol/L, M (Q1, Q3)] | 2.77 (2.26, 3.28) | 2.75 (2.25, 3.26) | 2.83 (2.36, 3.35) | -2.43 | 0.015 |
| FPG [mmol/L, M (Q1, Q3)] | 5.15 (4.86, 5.49) | 5.14 (4.85, 5.48) | 5.25 (4.96, 5.60) | -4.35 | <0.001 |
| HbA1c [%, M (Q1, Q3)] | 5.53 (5.37, 5.75) | 5.52 (5.37, 5.75) | 5.57 (5.40, 5.60) | -1.81 | 0.070 |
| Smoking,n (%) | 1352 (36.05) | 1109 (33.44) | 243 (55.99) | 84.62 | <0.001 |
| Drinking,n (%) | 1589 (42.37) | 1362 (41.07) | 227 (52.30) | 19.82 | <0.001 |
| Hypertension,n (%) | 341 (9.09) | 302 (9.11) | 39 (8.99) | 0.01 | 0.510 |
| Diabetes,n (%) | 106 (2.83) | 97 (2.93) | 9 (2.07) | 1.01 | 0.200 |
| Hyperlipidemia,n (%) | 140 (3.73) | 123 (3.71) | 17 (3.92) | 0.05 | 0.455 |
| Antihypertensive medication,n (%) | 139 (3.71) | 118 (3.56) | 21 (4.84) | 1.76 | 0.119 |
| Antidiabetic drug,n (%) | 49 (1.31) | 41 (1.24) | 8 (0.02) | 1.10 | 0.200 |
| Lipid-lowering agents,n (%) | 72 (1.92) | 61 (1.84) | 11 (2.53) | 0.98 | 0.205 |
| MetS, n (%) | 430 (11.47) | 276 (8.32) | 154 (35.48) | 278.87 | <0.001 |
Abbreviations: Avg METS-IR Average metabolic syndrome-insulin resistance, WC Waist circumference, SBP Systolic blood pressure, DBP Diastolic blood pressure, BMI Body mass index, ALT Alanine aminotransferase, AST Aspartate aminotransferase, GGT Gamma-glutamyl transferase, Scr Serum creatinine, SUA Serum uric acid, eGFR Estimated glomerular filtration rate, TC Total cholesterol, TG Triglyceride, HDL-C High-density lipoprotein cholesterol, LDL-C Low-density lipoprotein cholesterol, FPG Fasting plasma glucose, HbA1c Glycated hemoglobin
Incidence of MetS according to METS-IR trajectory group
As shown in Table 1, over a median observation period of 2.13 years, there were 430 cases of MetS (accounting for 11.47% of the total), including 71 men and 359 women. There was a marked contrast in the risk of MetS between the two groups, with a significantly greater likelihood of onset in the high-stability group than in the low-stability group (35.48% vs 8.32%, P < 0.001). Analysis by sex revealed incidence rates of 3.80% and 28.07%, respectively, in the low-stability and high-stability groups for men (P < 0.001) and the respective rates of 11.82% and 36.60% in women (P < 0.001). Figure S4 shows the cumulative incidence curves for the total population according to the METS-IR trajectory groups, indicating the trend in risk of MetS over time. MetS was markedly more likely to develop in the high-stability group than in the low-stability group.
Univariate Cox proportional hazards regression
A Cox proportional hazards regression model was used to examine how factors such as sex, age, and WC influenced the likelihood of developing MetS during the follow-up period. The presence or absence of MetS during this time was treated as the dependent variable (yes = 1, no = 0). Univariate Cox regression analysis showed that the METS-IR trajectory group, sex, age, SBP, DBP, BMI, ALT, AST, GGT, Scr, SUA, eGFR, TC, TG, HDL-C, LDL-C, FPG, HbA1c, smoking status, alcohol consumption status, history of hypertension, history of diabetes, use of antihypertensive medication, and use of antidiabetic therapy were associated with the onset of MetS (P < 0.05). Most of these factors had hazard ratios (HRs) above 1, suggesting a higher risk of MetS. Notably, HDL-C and eGFR had HRs less than 1, suggesting potentially protective effects against MetS (Table S2).
Multivariate Cox proportional hazards regression
The METS-IR trajectory group (using the low-stability group as the control) and factors identified to be significantly associated with occurrence of MetS in the univariate Cox proportional hazards analysis were used as independent variables. Variables that were strongly correlated with METS-IR or directly included in its calculation (BMI, FPG, HDL-C, and TGs) were excluded, and a multivariable Cox proportional hazards regression model was applied to assess the risk of MetS across the two METS-IR trajectory categories. The collinearity test showed no collinearity among the METS-IR trajectory group, sex, age, LDL-C, SUA, GGT, history of diabetes, and history of hypertension (Table S3).In the initial unadjusted model (model 1), the risk of developing MetS was markedly higher in the high-stability group than in the low-stability group (HR = 6.06, 95% confidence interval [CI]: 4.80–7.64). After adjustment for sex and age (model 2), this risk remained elevated in the high-stability group (HR = 5.04, 95% CI: 3.96–6.42). Further adjustments for hypertension and diabetes in model 3 slightly increased the HR to 5.25 (95% CI: 4.11–6.70). The most comprehensive model (model 4), which included GGT, LDL-C, and SUA in addition to the previous covariates, demonstrated a 4.77-fold increase in risk (95% CI: 3.71–6.13), confirming these variables to be significant predictors of onset of MetS (Tables 2 and 3). When stratified by age, participants younger than 45 years in the high-stability group had an alarming increase in risk of MetS (HR = 6.20, 95% CI: 4.31–8.92). Those aged 45 years or older in the high-stability group also had a marked increase in risk (HR = 3.89, 95% CI: 2.72–5.57), as shown in Table 2. Next, a nomogram that incorporated the variables that were statistically significant in the Cox regression analysis was constructed. A total score of 106 was associated with the respective 1-year, 2-year, and 3-year MetS incidence rates of 0.27%, 5.51%, and 9.82% (Fig. 2).
Table 2.
Risk models for the incidence of metabolic syndrome according to MetS-IR trajectory group
| Total Population | Age < 45 years | Age ≥ 45 years | ||||
|---|---|---|---|---|---|---|
| HR (95%CI) | P | HR (95%CI) | P | HR (95%CI) | P | |
| Model 1 | ||||||
| Low-stability Group | 1.000 | 1.000 | 1.000 | |||
| High-stability Group | 6.058 (4.803, 7.640) | <0.001 | 9.165 (6.557, 12.810) | <0.001 | 4.365 (3.118, 6.110) | <0.001 |
| Model 2 | ||||||
| Low-stability Group | 1.000 | 1.000 | 1.000 | |||
| High-stability Group | 5.042 (3.961, 6.416) | <0.001 | 6.832 (4.825, 9.674) | <0.001 | 3.811 (2.695, 5.389) | <0.001 |
| Model 3 | ||||||
| Low-stability Group | 1.000 | 1.000 | 1.000 | |||
| High-stability Group | 5.247 (4.111, 6.696) | <0.001 | 6.868 (4.842, 9.740) | <0.001 | 4.037 (2.839, 5.741) | <0.001 |
| Model 4 | ||||||
| Low-stability Group | 1.000 | 1.000 | 1.000 | |||
| High-stability Group | 4.770 (3.714, 6.126) | <0.001 | 6.202 (4.312, 8.921) | <0.001 | 3.891 (2.720, 5.566) | <0.001 |
Model 1, no adjustment; model 2, adjusted for sex and age (only for the total population); model 3, adjusted for sex, age (only for the total population) with addition of hypertension and diabetes status; model 4, based on model 3 with addition of gamma-glutamyl transferase, low-density lipoprotein cholesterol, serum uric acid
Table 3.
Cox proportional hazards regression model 4 for the risk of new-onset metabolic syndrome
| Variables | β | Sx̄ | Wald χ² | P | HR ( 95%CI ) |
|---|---|---|---|---|---|
| METS-IR trajectory groups (Q1) | 1.562 | 0.128 | 149.652 | <0.001 | 4.770 (3.714,6.126) |
| Gender (Male) | 0.768 | 0.158 | 23.519 | <0.001 | 2.156 (1.581,2.941) |
| Age (years) | 0.009 | 0.004 | 4.623 | 0.032 | 1.009 (1.001,1.017) |
| Hypertension (no hypertension) | 0.618 | 0.164 | 14.210 | <0.001 | 1.855 (1.345,2.558) |
| Diabetes (no diabetes) | 1.316 | 0.242 | 29.632 | <0.001 | 3.727 (2.321,5.986) |
| GGT (U/L) | 0.009 | 0.002 | 15.312 | <0.001 | 1.009 (1.004,1.013) |
| LDL-C (mmol/L) | 0.317 | 0.069 | 21.114 | <0.001 | 1.373 (1.199,1.572) |
| SUA (μmol/L) | 0.002 | 0.001 | 6.422 | 0.011 | 1.002 (1.000,1.004) |
Model 4: adjusted for sex, age, hypertension and diabetes status, GGT, SUA, LDL-C. IR trajectory group and gender are categorical variables, and the reference groups are marked after the variables
Abbreviations: GGT Gamma-glutamyl transferase, HR Hazard ratio, METS-IR Metabolic Score for Insulin Resistance, SUA Serum uric acid, LDL-C Low-density lipoprotein cholesterol
Fig. 2.

Nomogram for the Cox proportional hazards regression model. Abbreviations: GGT, gamma-glutamyl transferase; LDL-C, low-density lipoprotein cholesterol; METS-IR, Metabolic Score for Insulin Resistance; SUA, serum uric acid
ROC curves for prediction of new-onset MetS according to METS-IR trajectory group
The ability of the two predictive variables to identify participants at increased risk of MetS is shown in Fig. 3. Fig. 3A shows the ROC curve for prediction of MetS according to METS-IR trajectory group and Fig. 3B presents the ROC curves for the three-year average of METS-IR values. When the two METS-IR trajectory groups were used as predictors, the area under the ROC curve (AUC) was 0.575 (1 year), 0.641 (2 years), and 0.628 (3 years). Fig. 3B also demonstrated good prediction ability. Therefore, the METS-IR trajectory score, as used in this research, demonstrates the capacity to forecast the likelihood of an individual developing MetS in both short-term and long-term.
Fig. 3.

ROC curve for prediction of new-onset metabolic syndrome. A ROC curves for low-stability and high-stability METS-IR trajectory groups. B ROC curves with mean METS-IR values. AUC, area under the ROC curve; CI, confidence interval; METS-IR, Metabolic Score for Insulin Resistance; ROC, receiver-operating characteristic
Sensitivity analysis
Sensitivity analyses were performed by excluding subjects with missing data and those who met the criteria for MetS within a year after enrollment and classifying the METS-IR trajectory into three categories. All analyses retained their statistical significance, yielding results consistent with those for the overall study population. After exclusion of subjects with missing data, the sensitivity analysis showed that the risk of MetS was markedly higher in the high-stability group than in the low-stability group (HR = 4.952, 95% CI: 3.710–6.609) based on multivariate Cox proportional hazards regression using model 4. The sensitivity analysis after exclusion of subjects who developed MetS within one year also revealed that the risk of onset of MetS was higher in the high-stability group (HR = 4.894, 95% CI: 3.795–6.312). The sensitivity analysis that included the three METS-IR trajectory groups showed that the risk of MetS was significantly higher in both the high-stability group (HR = 46.959, 95% CI: 25.520–86.407) and medium-stability group (HR = 9.439, 95% CI: 6.271–14.407) than in the low-stability group (P < 0.001 for both). The details are shown in Tables S4, S5, and S6.
Discussion
This study investigated the relationship between METS-IR values and the incidence of MetS over time by analyzing health check-up data for 3,750 subjects collected between 2017 and 2019. The incidence rate for MetS was 35.48% in the high-stability group and 8.32% in the low-stability group (P < 0.001). The findings from age-specific analyses and sensitivity analyses aligned with those of the overall population, suggesting that a persistently high METS-IR value is associated with a higher risk of developing MetS.
MetS is alarmingly common worldwide. According to findings from the China Nutrition and Health Surveillance, up to 31.1% of people aged 20 years or older in China are affected by MetS, which highlights just how widespread the condition has become [28]. Data for 1999–2018 show that the prevalence of MetS has escalated from 28.23% to 37.09% [29]. The detrimental impact of MetS on human health is multifaceted and has significant public health implications [30]. Several studies have suggested a connection between IR and increased risks of CVD and mortality [31–34]. Other research indicates that individuals with MetS have a 25% increased risk of developing dementia of any cause (HR = 1.25, 95% CI: 1.19–1.30) and that the risk increases with an increasing number of MetS components [35]. Further exploration of the relationship between IR and MetS in the longer term could help to delay or even prevent the onset and progression of MetS and related diseases.
The METS-IR trajectory reflects the dynamic changes in IR associated with MetS over time. These changes are influenced by various factors. A persistently high METS-IR trajectory indicates that the body is remaining in a state of IR for an extended period, potentially triggering MetS gradually via mechanisms such as inflammatory pathways and dysfunction in adipose tissue [36]. The complex pathology of MetS results from multifaceted interactions, primarily among IR, abnormalities in adipose tissue, chronic inflammation, disorders of lipid metabolism, and genetic factors [37]. When IR develops, the sensitivity of the body’s cells to insulin decreases, resulting in reduced efficiency of glucose utilization and triggering a series of stress responses that activate inflammatory signaling pathways. This effect increases the production and activity of pro-inflammatory mediators, including tumor necrosis factor. These inflammatory cytokines further disrupt insulin signaling, thereby creating a vicious cycle that exacerbates IR. Inflammation further promotes the manifestations of MetS, including dyslipidemia and hypertension [38]. Adipose tissue can secrete various adipokines to maintain metabolic balance in the body, and IR is closely associated with dysfunction in this tissue. However, in a state of IR, functional abnormalities may develop in adipose tissue. On the one hand, hypertrophy and hyperplasia of adipocytes lead to the secretion of a large number of inflammatory cytokines, which may further exacerbate IR. On the other hand, there is an imbalance in the secretion of adipokines by adipocytes, with decreased secretion of adiponectin and increased secretion of hormones such as resistin and leptin. Given that these adipokines have roles in improving insulin sensitivity, reducing inflammation, and preventing atherosclerosis, their disordered secretion may exacerbate IR and gradually lead to the emergence of other symptoms of MetS [39].
The results of our study indicate that sex, age, hypertension status, diabetes status, and SUA, LDL-C, and GGT levels are prognostic factors for MetS. This finding can be explained as follows. First, sex-specific differences can affect the expression of IR; for example, men and postmenopausal women are more likely to develop IR and MetS [40]. With increasing age, the body’s metabolic efficiency decreases and IR gradually worsens, increasing the risk of MetS [41]. High IR is closely associated with obesity, particularly abdominal obesity. Obesity can lead to abnormal function in adipose tissue, including release of excessive amounts of free fatty acids, which exacerbate IR further [42]. Second, IR can lead to increased sodium reabsorption in the kidney, resulting in water-sodium retention and elevated blood pressure. IR may also lead to elevated blood pressure by activating the sympathetic nervous system and causing dysfunction in vascular endothelium [43, 44]. The significant between-group difference in the HDL-C levels observed in our study can be explained by the fact that IR interferes with lipid metabolism. Research indicates an inverse relationship between IR and HDL-C levels; that is, more severe IR is associated with a lower HDL-C level [45]. Lifestyle and disease factors such as smoking, alcohol consumption, hypertension, and history of diabetes also contribute to the likelihood of developing IR and MetS [46]. Inflammation and oxidative stress are integral to the etiology of IR. Inflammatory factors and oxidative stress can further damage the insulin signaling pathway, exacerbate IR, and have an adverse impact on the cardiovascular system, leading to elevated blood pressure [47]. In summary, the factors influencing MetS are complex and may also be related to other factors, such as imbalance in the gut microbiota and specific genetic determinants [48, 49].
The multivariable Cox regression analysis adjusted for multiple confounders showed that the risk of MetS was higher in the high-stability group than in the low-stability group. After considering all these factors, persistent IR remained an important independent predictor of the risk of MetS. This finding underscores the importance of long-term monitoring and management of IR, especially in high-risk populations. Our findings also highlight the potential value of long-term assessment of IR in terms of disease prediction in that it will help to identify individuals at high risk of MetS at an early stage and provide an opportunity for clinical intervention.
Glucagon-like peptide-1 receptor agonists (GLP-1 RAs) are a novel class of agents that have been widely studied and were initially used to treat type 2 diabetes [50]. By activating GLP-1 receptors, they stimulate release of insulin and suppress production of glucagon in response to glucose levels, thereby effectively reducing blood glucose and significantly decreasing HbA1c levels [51]. In vitro studies have shown that GLP-1 can improve IR by inhibiting the inflammatory response of macrophages [52]. GLP-1 RAs also have protective cardiovascular effects and can reduce the incidence of CVD. In some large-scale trials, GLP-1 RAs have reduced the cardiovascular event rate and improved liver transaminase levels [53]. Looking ahead, further exploration is warranted to determine whether GLP-1 RAs and other agents can protect against the development of IR and MetS, thereby expanding our understanding of their therapeutic potential in complex metabolic diseases.
Considering the need to generate timely data, to exclude periods affected by the COVID-19 pandemic, and to account for the extensive amount of time required to organize data from 2022 onwards, data for 2017–2019 and 2020–2022 were selected for analysis. Moreover, an unhealthy lifestyle lasting for more than two years can lead to an increased risk of MetS. A longitudinal study of machine learning-assisted risk prediction for MetS using medical examination records from three consecutive years [54] found that the risk of developing MetS in the third year could be predicted based on the medical data from the first two years. Therefore, the follow-up duration was considered sufficient to capture cases of MetS.
Strengths and limitations
Given that METS-IR testing is convenient (requiring no insulin measurement), its long-term monitoring has practical advantages in primary healthcare. By investigating the relationship between the change in the METS-IR trajectory and the incidence of MetS, this study revealed the important role of changes in IR in the pathogenesis of this syndrome, thereby enabling early identification of populations at high risk of developing MetS. However, the follow-up duration was shorter than in most other studies of MetS. Some MetS-related diseases may require longer time to manifest. Therefore, a three-year observation period might not completely reflect the entire long-term progression of these conditions. The risk of MetS onset over a longer follow-up period will be investigated in the future. Finally, the ability to extrapolate the findings of this research to other study populations may be limited. Multicenter studies with more diverse populations are required in the future to enhance generalizability.
Conclusions
The results of this retrospective cohort study confirm that IR levels measured over time can independently predict the future risk of MetS. These results also underscore the importance of monitoring for IR and its management in high-risk populations to facilitate timely detection and the implementation of therapeutic measures for those with an elevated risk of MetS.Our findings suggest that monitoring of long-term IR levels should be prioritized in patient care. Incorporating such monitoring into routine clinical practice, combined with lifestyle interventions and pharmacotherapy, can mitigate IR, reducing the incidence of MetS and related comorbidities.
Supplementary Information
Acknowledgements
The authors would like to thank the staff of The First Affiliated Hospital of Zhengzhou University for their assistance in data collection and the participants for their valuable contributions to this study.
Abbreviations
- MetS
Metabolic syndrome
- TG
Triglyceride
- HDL-C
High-density lipoprotein cholesterol
- CVD
Cardiovascular diseases
- IR
Insulin resistance
- METS-IR
Metabolic score for insulin resistance
- HOMA-IR
Homeostatic model assessment of insulin resistance index
- HOMA-AD
Homeostasis model assessment for adiponectin
- BMI
Body mass index
- WC
Waist circumference
- FPG
Fasting plasma glucose
- TC
Total cholesterol
- LDL-C
Low-density lipoprotein cholesterol
- SUA
Serum uric acid
- eGFR
Estimated glomerular filtration rate
- ALT
Alanine aminotransferase
- AST
Aspartate aminotransferase
- GGT
Gamma-glutamyl transferase
- Scr
Serum creatinine
- HbA1c
Glycated hemoglobin
- SBP
Systolic blood pressure
- DBP
Diastolic blood pressure
- AIC
Akaike information criterion
- BIC
Bayesian information criterion
- APPA
Average posterior probability of assignment
- ROC
Receiver operating characteristic
- HRs
Hazard ratios
- CI
Confidence interval
- AUC
Area under the ROC curve
- GLP-1RAs
Glucagon-like peptide-1 receptor agonists
Authors' contributions
Song Jianan, Ding Suying, amd Chen Jingfeng: Conceived and designed the experiments, and wrote the paper; Song Jianan, Yan Su, Wang Youxiang, and Chen Jingfeng: Organized the data and performed statistical analysis; Chen Jingfeng and Zhu Peimeng: Collected the data; Ding Suying and Chen Jingfeng: Provided research guidance and revised the paper; Ding Suying and Chen Jingfeng: Provided financial support.
Funding
National Natural Science Foundation of China (72101236); China Postdoctoral Science Foundation (2022M722900); Henan province science and technology research project (242102311099); Henan Province Key Scientific Research Projects of Universities (25A320073); Collaborative Innovation Project of Zhengzhou City (XTCX2023006); Nursing team project of the First Affiliated Hospital of Zhengzhou University (HLKY2023005).
Data availability
No datasets were generated or analysed during the current study.
Declarations
Ethics approval and consent to participate
All methods concerning human participants in our study were conducted in accordance with the ethical standards laid out in the 1964 Declaration of Helsinki and its subsequent amendments. The study protocol was approved by the ethics committee of the First Affiliated Hospital of Zhengzhou University, Zhengzhou, China (approval No. 2018-KY-56). Written informed consent was obtained from all participants.
Consent for publication
The patients/participants provided their written informed consent to participate in this study.
Competing interests
The authors declare no competing interests.
Footnotes
The original online version of this article was revised: The author reported a typesetting mistake. Tables 1 and 2 were missing in the main text.
Publisher’s note
Springer Nature remains neutral with regard to jurisdictional claims in published maps and institutional affiliations.
Change history
10/21/2025
The original online version of this article was revised: The author reported a typesetting mistake. Tables 1 and 2 were missing in the main text.
Change history
10/25/2025
A Correction to this paper has been published: 10.1186/s12944-025-02778-1
References
- 1.Jameel F, Phang M, Wood LG, Garg ML. Acute effects of feeding fructose, glucose and sucrose on blood lipid levels and systemic inflammation. Lipids Health Dis. 2014;13:195. [DOI] [PMC free article] [PubMed] [Google Scholar]
- 2.Sun Y, Lin X, Zou Z, Zhou Y, Liu A, Li X, et al. Association between visceral fat area and metabolic syndrome in individuals with normal body weight: insights from a Chinese health screening dataset. Lipids Health Dis. 2025;24: 57. [DOI] [PMC free article] [PubMed] [Google Scholar]
- 3.Guo J, Mutailipu K, Wen X, Yin J, You H, Qu S, et al. Association between lymphocyte to high-density lipoprotein cholesterol ratio and insulin resistance and metabolic syndrome in US adults: results from NHANES 2007–2018. Lipids Health Dis. 2025;24(1): 9. [DOI] [PMC free article] [PubMed] [Google Scholar]
- 4.Safaei M, Sundararajan EA, Driss M, Boulila W, Shapi’i A. A systematic literature review on obesity: understanding the causes & consequences of obesity and reviewing various machine learning approaches used to predict obesity. Comput Biol Med. 2021;136: 104754. [DOI] [PubMed] [Google Scholar]
- 5.Cai X-T, Zhu Q, Liu S-S, Wang M-R, Wu T, Hong J, et al. Associations between the metabolic score for insulin resistance index and the risk of type 2 diabetes mellitus among non-obese adults: insights from a population-based cohort study. Int J Gen Med. 2021;14:7729–40. [DOI] [PMC free article] [PubMed] [Google Scholar]
- 6.Bjornstad P, Eckel RH. Pathogenesis of lipid disorders in insulin resistance: a brief review. Curr Diab Rep. 2018;18: 127. [DOI] [PMC free article] [PubMed] [Google Scholar]
- 7.Yang W, Cai X, Hu J, Wen W, Mulalibieke H, Yao X, et al. The metabolic score for insulin resistance (METS-IR) predicts cardiovascular disease and its subtypes in patients with hypertension and obstructive sleep apnea. Clin Epidemiol. 2023;15:177–89. [DOI] [PMC free article] [PubMed] [Google Scholar]
- 8.Cai X, Gao J, Hu J, Wen W, Zhu Q, Wang M, et al. Dose-response associations of metabolic score for insulin resistance index with nonalcoholic fatty liver disease among a Nonobese Chinese population: retrospective evidence from a population-based cohort study. Dis Markers. 2022;2022:4930355. [DOI] [PMC free article] [PubMed] [Google Scholar]
- 9.Wen S, Huang X, Huang Z, Deng Z, Zhou C, Chen N, et al. Association between the cumulative metabolic score for insulin resistance and diabetes mellitus incidence: a prospective nationwide cohort study in China. Endokrynol Pol. 2025;76(3):301–12. [DOI] [PubMed] [Google Scholar]
- 10.Khalid M, Alkaabi J, Khan MAB, Adem A. Insulin signal transduction perturbations in insulin resistance. Int J Mol Sci. 2021;22(16): 8590. [DOI] [PMC free article] [PubMed] [Google Scholar]
- 11.Roberts CK, Hevener AL, Barnard RJ. Metabolic syndrome and insulin resistance: underlying causes and modification by exercise training. Prakash YS, editor. Compr Physiol. 2013;3:1–58. [DOI] [PMC free article] [PubMed] [Google Scholar]
- 12.Wang J, Yang J, Chen Y, Rui J, Xu M, Chen M. Association of METS-IR index with prevalence of gallbladder stones and the age at the first gallbladder stone surgery in US adults: a cross-sectional study. Front Endocrinol. 2022;13: 1025854. [Google Scholar]
- 13.Bello-Chavolla OY, Almeda-Valdes P, Gomez-Velasco D, Viveros-Ruiz T, Cruz-Bautista I, Romo-Romo A, et al. METS-IR, a novel score to evaluate insulin sensitivity, is predictive of visceral adiposity and incident type 2 diabetes. Eur J Endocrinol. 2018;178(5):533–44. [DOI] [PubMed] [Google Scholar]
- 14.Xie Q, Kuang M, Lu S, Huang X, Wang C, Zhang S, et al. Association between MetS-IR and prediabetes risk and sex differences: a cohort study based on the Chinese population. Front Endocrinol. 2023;14: 1175988. [Google Scholar]
- 15.Tahapary DL, Pratisthita LB, Fitri NA, Marcella C, Wafa S, Kurniawan F, et al. Challenges in the diagnosis of insulin resistance: focusing on the role of HOMA-IR and tryglyceride/glucose index. Diabetes Metab Syndr. 2022;16: 102581. [DOI] [PubMed] [Google Scholar]
- 16.Yoon J, Heo S-J, Lee J-H, Kwon Y-J, Lee JE. Comparison of METS-IR and HOMA-IR for predicting new-onset CKD in middle-aged and older adults. Diabetol Metab Syndr. 2023;15: 230. [DOI] [PMC free article] [PubMed] [Google Scholar]
- 17.Duan M, Zhao X, Li S, Miao G, Bai L, Zhang Q, et al. Metabolic score for insulin resistance (METS-IR) predicts all-cause and cardiovascular mortality in the general population: evidence from NHANES 2001–2018. Cardiovasc Diabetol. 2024;23: 243. [DOI] [PMC free article] [PubMed] [Google Scholar]
- 18.Cândido APC, Geloneze B, Calixto A, Vasques ACJ, Freitas RN, Freitas SN, et al. Adiponectin, HOMA-adiponectin, HOMA-IR in children and adolescents: Ouro Preto study. Indian J Pediatr. 2021;88(4):336–44. [DOI] [PubMed] [Google Scholar]
- 19.He S, Kuang Y, Huang X, Jian Y, Zhang J, Huang W, et al. Impact of triglyceride glucose-weight adjusted waist index and its cumulative exposure on stroke risk: a nationwide prospective cohort study. Lipids Health Dis. 2025;24(1): 243. [DOI] [PMC free article] [PubMed] [Google Scholar]
- 20.Wang Q, Song X, Du S, Du W, Su C, Zhang J, et al. Waist circumference trajectories in relation to blood pressure and the risk of hypertension in Chinese adults. Nutrients. 2022;14:5260. [DOI] [PMC free article] [PubMed] [Google Scholar]
- 21.Wang JG. Chinese guidelines for the prevention and treatment of hypertension (2024 revision). J Geriatr Cardiol. 2025;22(1):1–149. [DOI] [PMC free article] [PubMed] [Google Scholar]
- 22.Catapano AL, Graham I, De Backer G, Wiklund O, Chapman MJ, Drexel H, et al. 2016 ESC/EAS guidelines for the management of dyslipidaemias. Revista Española De Cardiología (English Edition). 2017;70(2):115. [Google Scholar]
- 23.American Diabetes Association. Diagnosis and classification of diabetes mellitus. Diabetes Care. 2011;34:S62-9. [DOI] [PMC free article] [PubMed] [Google Scholar]
- 24.Zhang X, Liu F, Li W, Zhang J, Zhang T, Yu X, et al. Metabolic score for insulin resistance (mets-ir) predicts adverse cardiovascular events in patients with type 2 diabetes and ischemic cardiomyopathy. Diabetes Metab Syndr Obes. 2023;16:1283–95. [DOI] [PMC free article] [PubMed] [Google Scholar]
- 25.Yan R, Zhang J, Ma H, Wu Y, Fan Y. Potential of seven insulin resistance indicators as biomarkers to predict infertility risk in U.S. women of reproductive age: a cross-sectional study. Reprod Biol Endocrinol. 2025;23(1):77. [DOI] [PMC free article] [PubMed] [Google Scholar]
- 26.Chinese Diabetes Society. Guideline for the prevention and treatment of diabetes mellitus in China (2024 edition). Chin J Diabetes Mellitus. 2025;17(1):16–139.
- 27.Yuan Y, Chen S, Lin C, Huang X, Lin S, Huang F, et al. Association of triglyceride-glucose index trajectory and frailty in urban older residents: evidence from the 10-year follow-up in a cohort study. Cardiovasc Diabetol. 2023;22: 264. [DOI] [PMC free article] [PubMed] [Google Scholar]
- 28.Yao F, Bo Y, Zhao L, Li Y, Ju L, Fang H, et al. Prevalence and influencing factors of metabolic syndrome among adults in China from 2015 to 2017. Nutrients. 2021;13: 13:4475. [DOI] [PMC free article] [PubMed] [Google Scholar]
- 29.Saklayen MG. The global epidemic of the metabolic syndrome. Curr Hypertens Rep. 2018;20: 12. [DOI] [PMC free article] [PubMed] [Google Scholar]
- 30.Hayden MR. Overview and new insights into the metabolic syndrome: risk factors and emerging variables in the development of type 2 diabetes and cerebrocardiovascular disease. Med (Kaunas). 2023;59:561. [Google Scholar]
- 31.Moshkovits Y, Rott D, Chetrit A, Dankner R. The association between insulin sensitivity indices, ECG findings and mortality: a 40-year cohort study. Cardiovasc Diabetol. 2021;20:97. [DOI] [PMC free article] [PubMed] [Google Scholar]
- 32.Wu Z, Cui H, Zhang Y, Liu L, Zhang W, Xiong W, et al. The impact of the metabolic score for insulin resistance on cardiovascular disease: a 10-year follow-up cohort study. J Endocrinol Invest. 2022;46:523–33. [DOI] [PubMed] [Google Scholar]
- 33.Hou X-Z, Lv Y-F, Li Y-S, Wu Q, Lv Q-Y, Yang Y-T, et al. Association between different insulin resistance surrogates and all-cause mortality in patients with coronary heart disease and hypertension: NHANES longitudinal cohort study. Cardiovasc Diabetol. 2024;23: 86. [DOI] [PMC free article] [PubMed] [Google Scholar]
- 34.Hill MA, Yang Y, Zhang L, Sun Z, Jia G, Parrish AR, et al. Insulin resistance, cardiovascular stiffening and cardiovascular disease. Metabolism. 2021;119: 154766. [DOI] [PubMed] [Google Scholar]
- 35.Chen TS, Mi N-N, Lao HY, Wang C-Y, Lo WLA, Mao Y-R, et al. Investigating the nexus of metabolic syndrome, serum uric acid, and dementia risk: a prospective cohort study. BMC Med. 2024;22: 115. [DOI] [PMC free article] [PubMed] [Google Scholar]
- 36.Romeo GR, Lee J, Shoelson SE. Metabolic syndrome, insulin resistance, and roles of inflammation–mechanisms and therapeutic targets. Arterioscler Thromb Vasc Biol. 2012;32:1771–6. [DOI] [PMC free article] [PubMed] [Google Scholar]
- 37.Zafar U, Khaliq S, Ahmad HU, Manzoor S, Lone KP. Metabolic syndrome: an update on diagnostic criteria, pathogenesis, and genetic links. Horm (Athens). 2018;17:299–313. [Google Scholar]
- 38.Zand H, Morshedzadeh N, Naghashian F. Signaling pathways linking inflammation to insulin resistance. Diabetes Metab Syndr. 2017;11(Suppl 1):S307-9. [DOI] [PubMed] [Google Scholar]
- 39.Shimobayashi M, Albert V, Woelnerhanssen B, Frei IC, Weissenberger D, Meyer-Gerspach AC, et al. Insulin resistance causes inflammation in adipose tissue. J Clin Invest. 2018;128:1538–50. [DOI] [PMC free article] [PubMed] [Google Scholar]
- 40.Yoon H, Kim YS, Lee JH, Gi MY, Cha JA, Seong JM. Gender difference in the relationship between the ferritin and homeostasis model assessment of insulin resistance in non-diabetic Korean adults. PLoS One. 2018;13: e0199465. [DOI] [PMC free article] [PubMed] [Google Scholar]
- 41.Lin C-A, Liu Y-P, Chen Y-C, Yu W, Xiong X-J, Huang H-Y, et al. Gender-specific and age-specific associations of the homoeostasis model assessment for IR (HOMA-IR) with albuminuria and renal function impairment: a retrospective cross-sectional study in Southeast China. BMJ Open. 2021;11: e053649. [DOI] [PMC free article] [PubMed] [Google Scholar]
- 42.Gobato AO, Vasques ACJ, Zambon MP, Barros Filho A, de Hessel A. Metabolic syndrome and insulin resistance in obese adolescents. Rev Paul Pediatr. 2014;32:55–62. [DOI] [PMC free article] [PubMed] [Google Scholar]
- 43.Xu C, Song G, Hu D, Li G, Liu Q, Tang X. Association of METS-IR with incident hypertension in non-overweight adults based on a cohort study in Northeastern China. Eur J Public Health. 2022;32:884–90. [DOI] [PMC free article] [PubMed] [Google Scholar]
- 44.Liu XZ, Fan J, Pan SJ. METS-IR, a novel simple insulin resistance indexes, is associated with hypertension in normal-weight Chinese adults. J Clin Hypertens. 2019;21:1075–81. [Google Scholar]
- 45.Altinova AE, Toruner F, Bukan N, Yasar DG, Akturk M, Cakir N, et al. Decreased plasma adiponectin is associated with insulin resistance and HDL cholesterol in overweight subjects. Endocr J. 2007;54:221–6. [DOI] [PubMed] [Google Scholar]
- 46.Peplies J, Börnhorst C, Günther K, Fraterman A, Russo P, Veidebaum T, et al. Longitudinal associations of lifestyle factors and weight status with insulin resistance (HOMA-IR) in preadolescent children: the large prospective cohort study IDEFICS. Int J Behav Nutr Phys Act. 2016. 10.1186/s12966-016-0424-4. [DOI] [PMC free article] [PubMed] [Google Scholar]
- 47.Vassalle C, Gaggini M. Type 2 diabetes and oxidative stress and inflammation: pathophysiological mechanisms and possible therapeutic options. Antioxidants. 2022;11(5): 953. [DOI] [PMC free article] [PubMed] [Google Scholar]
- 48.Zhao J, Duan L, Li J, Yao C, Wang G, Mi J, et al. New insights into the interplay between autophagy, gut microbiota and insulin resistance in metabolic syndrome. Biomed Pharmacother. 2024;176: 116807. [DOI] [PubMed] [Google Scholar]
- 49.Wu Q, Li J, Sun X, He D, Cheng Z, Li J, et al. Multi-stage metabolomics and genetic analyses identified metabolite biomarkers of metabolic syndrome and their genetic determinants. EBioMedicine. 2021;74: 103707. [DOI] [PMC free article] [PubMed] [Google Scholar]
- 50.Gragnano F, De Sio V, Calabrò P. FLOW trial stopped early due to evidence of renal protection with semaglutide. Eur Heart J. 2024;10:7–9. [Google Scholar]
- 51.Zhang A, Zhang X, Yang A, Dong S, Wang L, Zhou H, et al. Effects of SGLT2 inhibitors and GLP-1 receptor agonists on glycemic variability, islet cell function, and insulin resistance in patients with type 2 diabetes mellitus and renal cell carcinoma. Am J Cancer Res. 2025;15:946–65. [DOI] [PMC free article] [PubMed] [Google Scholar]
- 52.Guo C, Huang T, Chen A, Chen X, Wang L, Shen F, et al. Glucagon-like peptide 1 improves insulin resistance in vitro through anti-inflammation of macrophages. Braz J Med Biol Res. 2016;49: e5826. [DOI] [PMC free article] [PubMed] [Google Scholar]
- 53.Xie Y, Choi T, Al-Aly Z. Mapping the effectiveness and risks of GLP-1 receptor agonists. Nat Med. 2025;31:951–62. [DOI] [PubMed] [Google Scholar]
- 54.Yang H, Yu B, OUYang P, Li X, Lai X, Zhang G, et al. Machine learning-aided risk prediction for metabolic syndrome based on 3 years study. Sci Rep. 2022;12: 2248. [DOI] [PMC free article] [PubMed] [Google Scholar]
Associated Data
This section collects any data citations, data availability statements, or supplementary materials included in this article.
Supplementary Materials
Data Availability Statement
No datasets were generated or analysed during the current study.