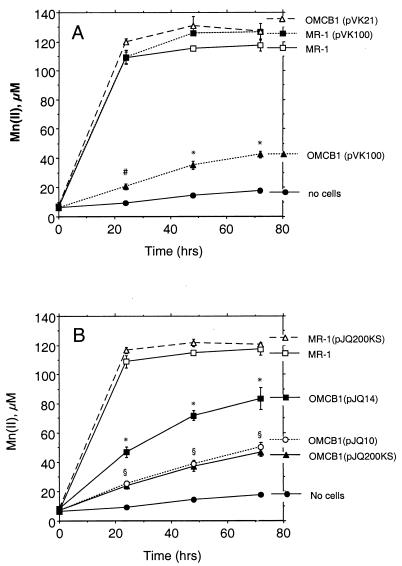
FIG. 9.
Reduction of δMnO2 under anaerobic conditions as determined by the formation of Mn(II) over time. Strains were complemented with DNA fragments cloned in pVK100 (A) or pJQ200KS (B). All values represent the mean ± standard deviation (n = 3 independent cultures of each strain). For points lacking apparent error bars, the bars were smaller than the points. An asterisk indicates that a value is statistically significantly different from the values for all other strains in the panel at P < 0.001; a number sign indicates that a value is statistically significantly different from the value for no cells at P < 0.05 and from the values for all other strains in the panel at P < 0.001; and a section sign indicates that the values for strains OMCB1(pJQ10) and OMCB1(pJQ200KS) are statistically the same but are statistically significantly different from the values for all other strains in the panel at P < 0.001.

