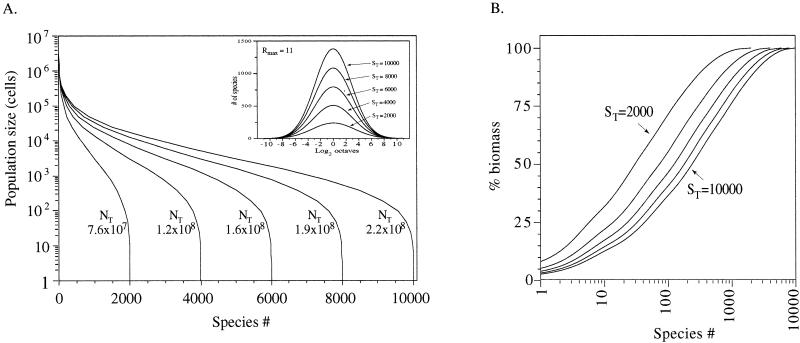
FIG. 5.
Theoretical lognormal model series most consistent with observed data from four Arizona soils. (A) Lognormal species rank abundance plots. Each curve shows the population size of each species (ranked in order of decreasing abundance) from the theoretical community. The sum of population sizes for all the species in a community is the calculated community size, NT. The inset panel illustrates the normal distribution achieved by plotting species population sizes on a geometric scale, log2. The first interval (the −11 octave) contains a single species represented by one individual (1 cell [g of soil]−1). The second octave contains species represented by two or three individuals, etc. (B) Cumulative biomass distribution for species from lognormal models shown in panel A. The species are ranked in order of decreasing abundance.

