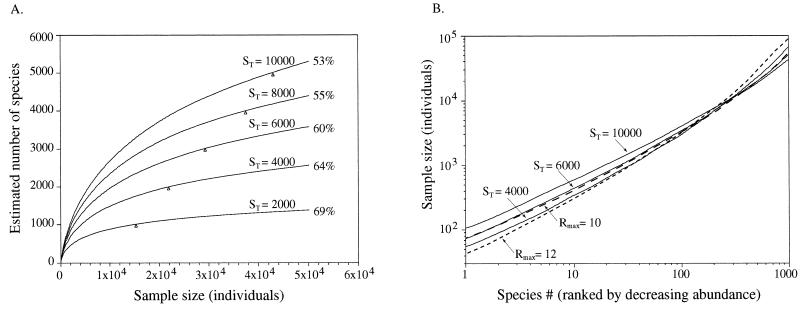
FIG. 6.
Sampling curves for lognormal model communities. (A) Species richness sampling curves. The curves were calculated by rarefaction. The number at the apex of each curve shows the percentage of the total number of species, ST, from each community expected in a sample size of 50,000 individuals. The triangles indicate the sample size required to document half the species richness of each model community. (B) Species composition sampling curves based on a 95% confidence interval. Each curve shows the sample size required for confident sampling of a specified set of species (each set includes the given species number on the x axis and all the preceding species on the x axis). Species are ranked in order of decreasing population size. Sampling curves from model communities that differ 2.5-fold in species number (Rmax11 curves) and 8-fold in community size (Rmax10 and Rmax12 curves) are shown.

