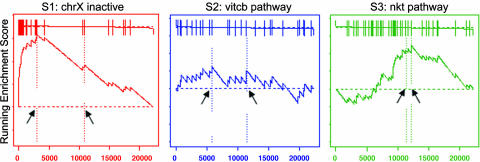
Fig. 2.
Original (4) enrichment score behavior. The distribution of three gene sets, from the C2 functional collection, in the list of genes in the male/female lymphoblastoid cell line example ranked by their correlation with gender: S1, a set of chromosome X inactivation genes; S2, a pathway describing vitamin c import into neurons; S3, related to chemokine receptors expressed by T helper cells. Shown are plots of the running sum for the three gene sets: S1 is significantly enriched in females as expected, S2 is randomly distributed and scores poorly, and S3 is not enriched at the top of the list but is nonrandom, so it scores well. Arrows show the location of the maximum enrichment score and the point where the correlation (signal-to-noise ratio) crosses zero. Table 1 compares the nominal P values for S1, S2, and S3 by using the original and new method. The new method reduces the significance of sets like S3.

