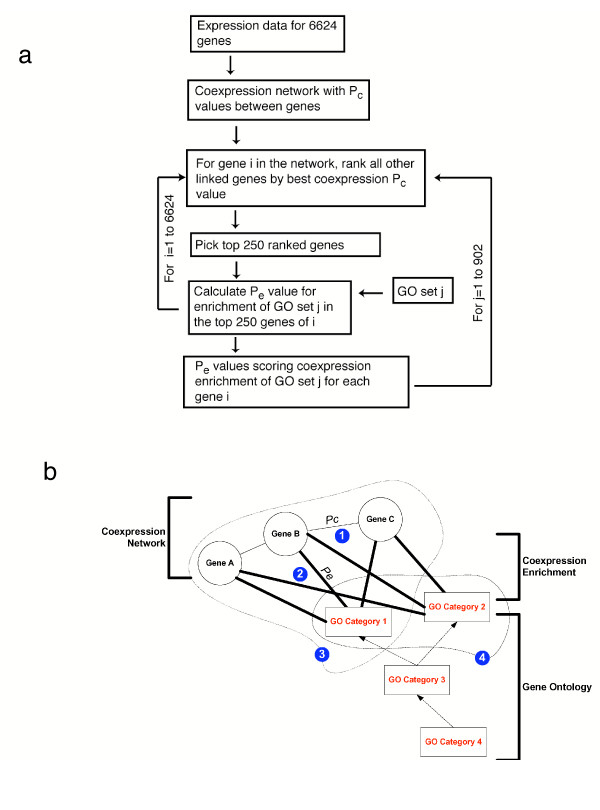
Figure 1.
Schematic representation of the steps in our analyses. (a) Example flow chart of the different steps for calculating gene set coexpression enrichment Pe values between each of the 6624 genes in the multi-species network and 902 GO sets. For each gene mi we use the hypergeometric distribution to calculate a coexpression enrichment Pe-value (Pe(mi, gj)) for whether GO set gj was significantly overrepresented in the top 250 genes with smallest Pc-values to mi. (b) The four steps in our analyses. 1. A coexpression network is generated with Pc values (multi-species network) or correlation coefficients (single-species network) scoring coexpression between gene pairs. 2. Coexpression enrichment Pe values are calculated between each gene and each GO category, such as between GO category 1 and genes A, B, and C and between GO category 2 and genes A, B, and C. 3. A score reflecting GBA is calculated for each GO category (e.g., GO category 1). 4. The interrelationship between pairs of GO categories is quantified, such as that between GO category 1 and GO category 2, which are sibling categories in a Gene Ontology graph, sharing GO category 3 as a common parent.

