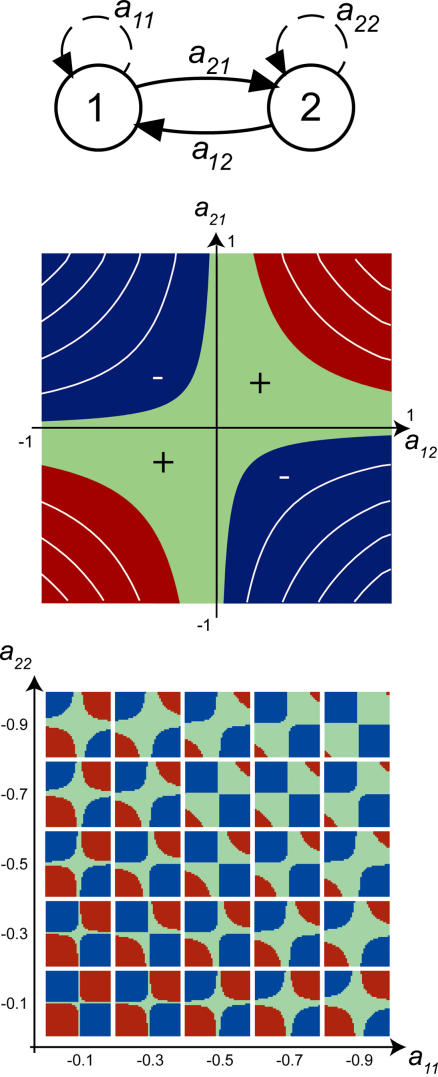
Figure 1. Dynamic Behaviors of a Two-Node Feedback Loop in Response to a Small Perturbation from Steady-State.
(Top) Schematic of a simple feedback circuit with the nodes and edges labeled.
(Middle) We illustrate the dependence of stability on the values of a 12 and a 21 as they are varied from −1 to 1, with constant self-degradation terms a 11 = −0.3 and a 22 = −0.7. The system can be stable (green), oscillatory (blue), or unstable (red). These regions are determined by gain k = a 12 a 21. Shown in white are contours of constant gain k. The quadrants labeled (+) correspond to positive feedback (a 12 and a 11 have the same sign), while the quadrants labeled (−) correspond to negative feedback (a 11 and a 21 have opposite signs).
(Bottom) The stability regions vary as the values of self-degradation terms a 11 and a 12 change. The more stable the open-loop nodes (more negative a 11 and a 22), the greater the regions of closed-loop stability. However, if a 11 and a 22 are close in sign and magnitude, the size of the oscillatory regions increases.

