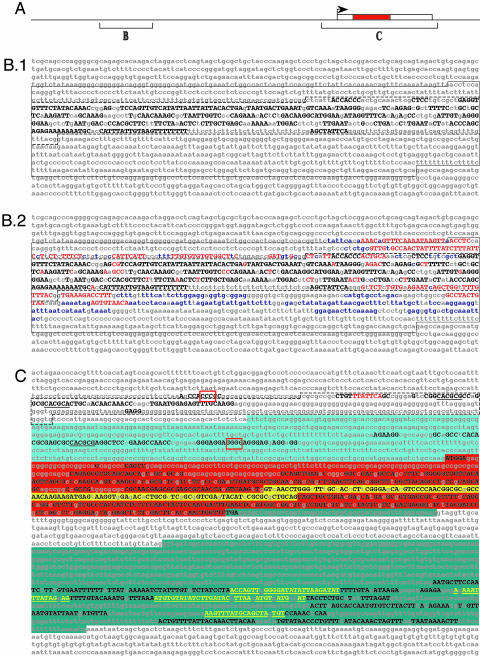
Fig. 1.
evoprinter analysis of the vertebrate achaete-scute homolog 1 locus. (A) A linear cartoon of the Ascl1 locus 15 kb used in the EvoP analysis indicating the approximate locations of sequences shown in B and C (box represents transcribed region with the red-colored inner box indicating the ORF). (B and C) EvoPs were generated with 15 kb of mouse (B) or human (C) reference-DNA that included the Ascl1-transcribed sequence plus 9 kb of upstream and 3 kb of downstream flanking intragenic sequence. We searched the following test genomes: human, chimpanzee, rhesus monkey, dog, rat, mouse, oppossum, chicken, and X. tropicalis. Invariant MCSs, shared by all test species, are identified with uppercase black letters. (B.1) An EvoP, using all test species, identifies clustered MCSs within the tissue- and region-specific regulatory region of the murine Mash1 CNS enhancer. Shown is the upper DNA strand of 1.9 kb corresponding to nucleotides -8692 to -6784 5′ to the murine Mash1-transcribed region. The solid lined box denotes the 1,158-bp CNS enhancer region, and the dashed-lined inner box identifies the 472-bp domain that contains multiple tissue/region-specific regulatory elements (21). (B.2) The MCSs that are gained when X. tropicalis is excluded from the analysis are shown as uppercase red letters and when both X. tropicalis and chicken genomes are excluded from the EvoP, the additional MCSs are shown as blue lowercase letters. Nonconserved nucleotides are indicated as lowercase gray letters. (C) EvoP analysis of the ash1 proximal promoter region, transcribed sequence, and flanking 3′ intragenic sequence reveals conserved MCSs that contain cis-regulatory and protein-encoding sequences. Shown is 3.9 kb of the human hash1 gene (nucleotides -687 to +3235). The hatched line box denotes a 259-bp region that contains the proximal enhancer and tissue-specific repressor regulatory elements (22). Underlined sequences are HES-1 DNA-binding sites, red-boxed sequences are potential binding sites for IA-1 and a potential FAST-1 binding site is highlighted with red-colored letters (see Results and Discussion). The 5′ UTR of the hash1 transcript is highlighted in light blue, the transcript ORF is shown with red background (the HLH coding sequence is marked with yellow background), and the 3′ untranslated sequence is indicated with a dark blue background. Yellow nucleotides in the 3′ trailer represent potential binding sites for 13 different microRNAs (see Results and Discussion). Note that the 3′ UTR is interrupted by a 359-bp intron (annotation according to the Ensembl sequence data base).

