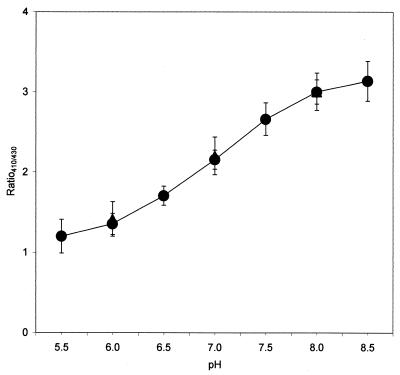
FIG. 1.
Correlation between pHi and R410/430 of ratiometric GFP in pH-equilibrated cells. L. lactis and E. coli single cells were equilibrated with 10 kIU of nisin ml−1 (closed circles) and 10 μM CCCP (closed triangles), respectively. Each point represents the mean value for 20 individual cells, with error bars indicating the standard deviations.

