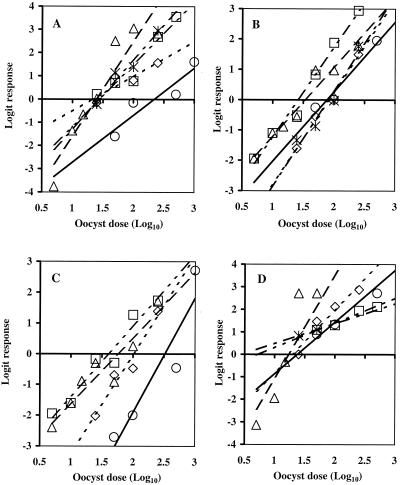
FIG. 1.
Dose-response curves for five genotype 2 isolates of C. parvum in CD-1 mice (A), HCT-8 cell monolayers (B), Caco-2 cell monolayers (C), and MDCK cell monolayers (D). The ID50 is the point at which the regression line crosses the logit response 0 axis. Infectivity was measured for the Iowa (○, ——), Moredun (□, - - — - -), TAMU (▵, — — —), Maine (⋄, - - - - -), and Glasgow (∗, — - —) isolates. Each data point is the logit of the mean proportional infectivity (Pinf) for three to six replicate cages of mice (9 to 12 mice per cage) or for two to seven replicate sets of cell cultures (6 to 10 monolayers per set) at each dose of oocysts.

