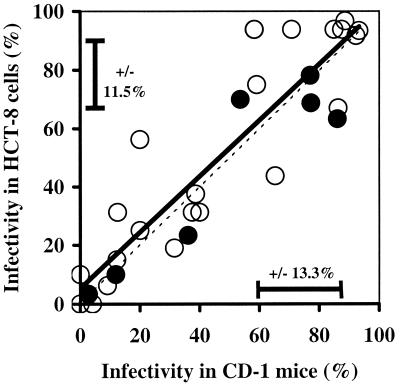
FIG. 5.
Comparison between infectivity in CD-1 mice and infectivity in the HCT-8 cell culture RT-PCR assay (R2 = 0.80) (solid regression line) for oocysts of the Iowa, TAMU, and Moredun isolates exposed to various doses of UV (•) and ozone (○). The horizontal and vertical error bars indicate the average standard deviations for all replicate analyses with oocysts exposed to disinfectants for CD-1 mice and HCT-8 cells, respectively. The dashed line indicates the theoretical 1:1 correlation. The same oocyst challenge doses were inoculated into CD-1 mice and HCT-8 monolayers for each dose of disinfectant.

