
FIGURE 1.
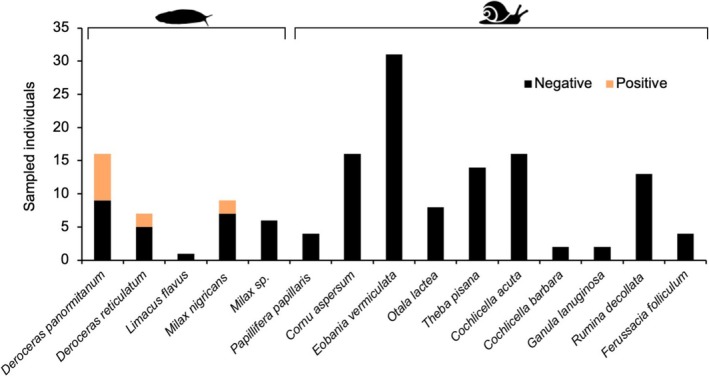
Stacked bar plot of infection status of gastropod species sampled in the 1 km radius study area according to AcanR3990 qPCR.
Official websites use .gov
A
.gov website belongs to an official
government organization in the United States.
Secure .gov websites use HTTPS
A lock (
) or https:// means you've safely
connected to the .gov website. Share sensitive
information only on official, secure websites.
Stacked bar plot of infection status of gastropod species sampled in the 1 km radius study area according to AcanR3990 qPCR.