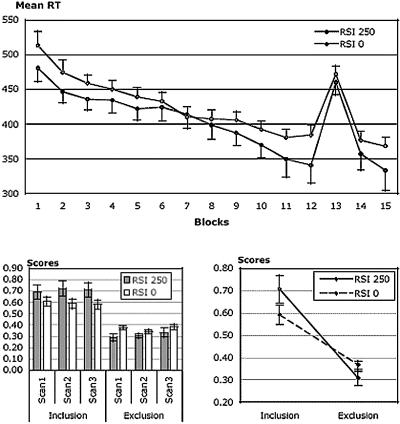
Figure 1.
Behavioral data. (Upper panel) Mean reaction times for each training block in the SRT task plotted separately for RSI0 and RSI250 participants. RT decreases across blocks through practice, but returns back to initial RT values when a different sequence (block 13) is presented, demonstrating learning of the repeated sequence. (Lower left panel) Mean generation scores measured in both conditions for the three Inclusion and Exclusion scans in RSI0 and RSI250 participants. Performance remains stable over replications/scans in all conditions. (Lower right panel) Mean generation scores averaged over the three Inclusion or Exclusion scans in the Inclusion or Exclusion task in RSI0 and RSI250 participants. Higher generation scores under the Inclusion than the Exclusion condition in RSI250 and RSI0 conditions indicates the presence of explicit knowledge in both RSI conditions. Under Inclusion instruction, higher generation score in the RSI250 than the RSI0 condition shows that participants in the RSI250 condition gained more sequence knowledge irrespective of its implicit/explicit status. Under Exclusion instruction, a higher generation score in RSI0 than RSI250 indicates higher implicit knowledge in the former condition.

