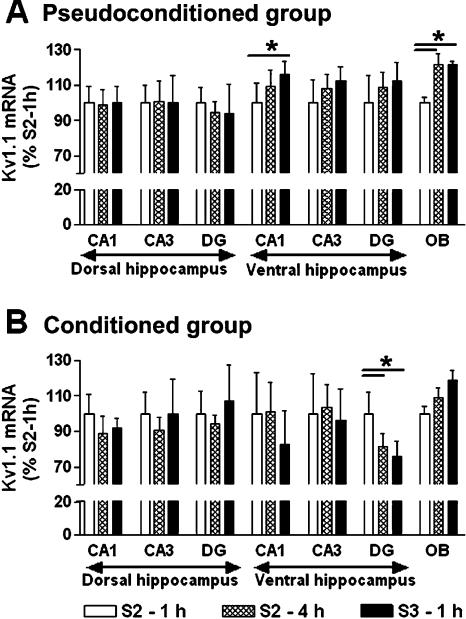
Figure 6.
Temporal analysis. Kv1.1 subunit mRNA levels for olfactory bulb and dorsal and ventral hippocampus regions in the pseudoconditioned (A) and conditioned groups (B). Data expressed as mean ±S.E.M. Statistical significance: (*) P < 0.05 in ANOVA comparing the different stages of learning, 1 h after session 2 (n = 6 and 7 for pseudoconditioned and conditioned group, respectively), 4 h after session 2 (n = 6 and 6), and 1 h after session 3 (n = 5 and 5).

