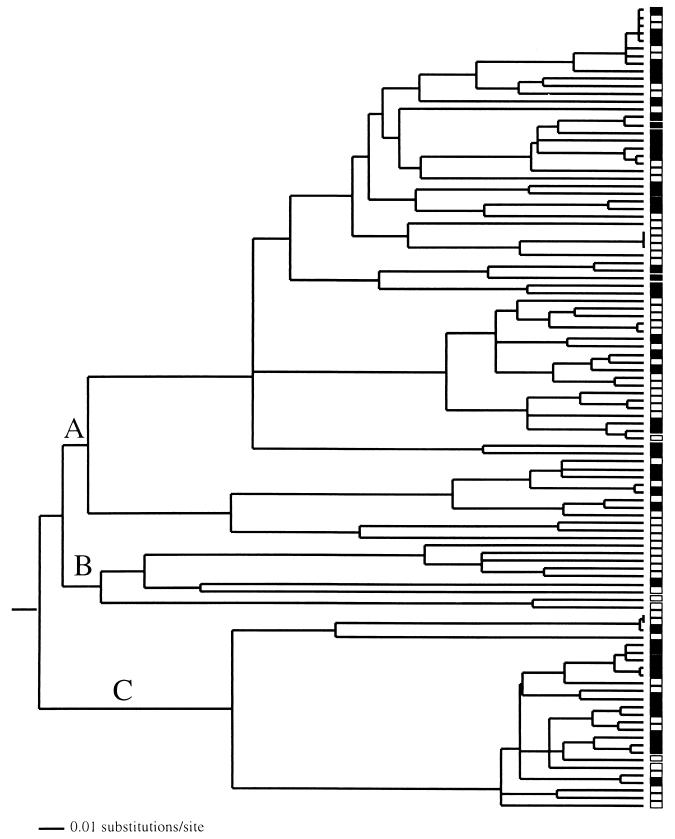
FIG. 6.
16S rDNA gene tree for the α-proteobacteria sampled from improved (solid boxes) and unimproved (open boxes) grasslands. The letters indicate specific clades that were subject to tests of differentiation (Table 3). The tree was produced by neighbor-joining clustering of genetic distances corrected for multiple substitutions by using a HKY + G + I model of evolution with PAUP* (25). (For details about the construction of phylogenetic trees from sequence data, see reference 26.) Optimization of the branch lengths was done by using the maximum-likelihood method (using the HKY + G + I model) subject to the constraint that all sampled sequences were contemporary (i.e., molecular clock was enforced).

