


Figure 4.
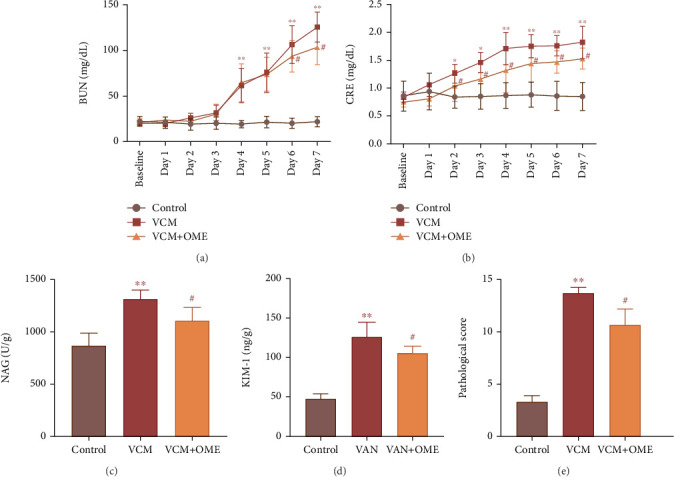
Comparison of renal function indicators and renal injury markers in rats. (a) BUN. (b) CRE. (c) NAG. (d) KIM-1. (e) Renal injury score. VAN: 400 mg/kg VAN; VAN + OME: 400 mg/kg VAN + 4 mg/kg OME; ∗p < 0.05, ∗∗p < 0.01 compared to the control group; #p < 0.05 compared to the VAN group.