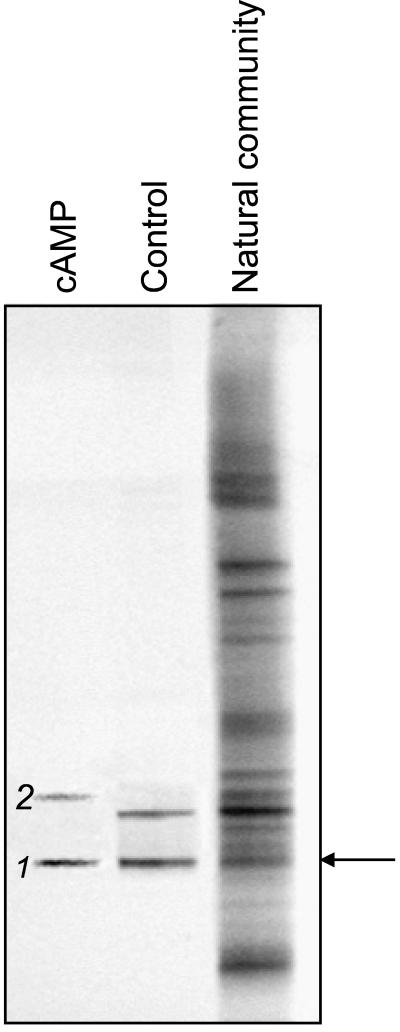
FIG. 3.
DGGE analysis of 16S rDNA fragments of the natural community at 200 m in depth and of bacteria cultured in liquid dilution series (ABWP medium, oxic incubation; compare results shown in Fig. 2B) from the same sample. The arrow indicates the band of the natural community which corresponds to band 1, the fingerprint of the isolated strain G100. Band 2 denotes a fingerprint which was obtained in the presence of cAMP but not with the control.

