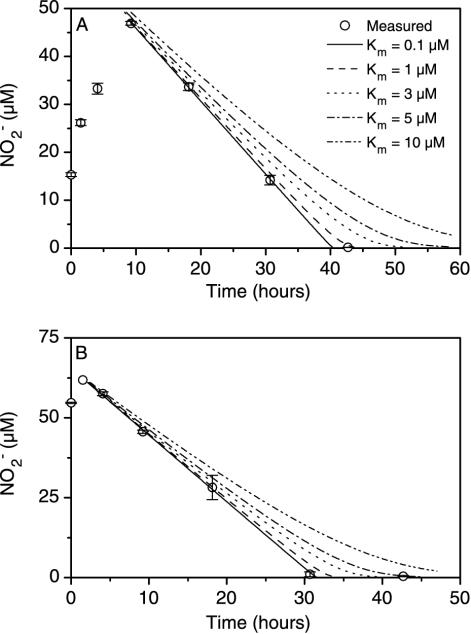
FIG. 2.
Concentrations of NO2− as functions of time in two experiments with either NO3− added (A) or NO2− added (B). The solid lines indicate the theoretical decrease in NO2− concentration assuming Michaelis-Menten kinetics and a Km value of 0.1 μM, a maximum NO2− reduction rate calculated as the slope of the linear portion of the curve, and an initial concentration calculated as the intersection of this linear regression with the y axis. The other lines depict the decrease in NO2− concentration assuming higher Km values. Error bars indicate standard errors.

