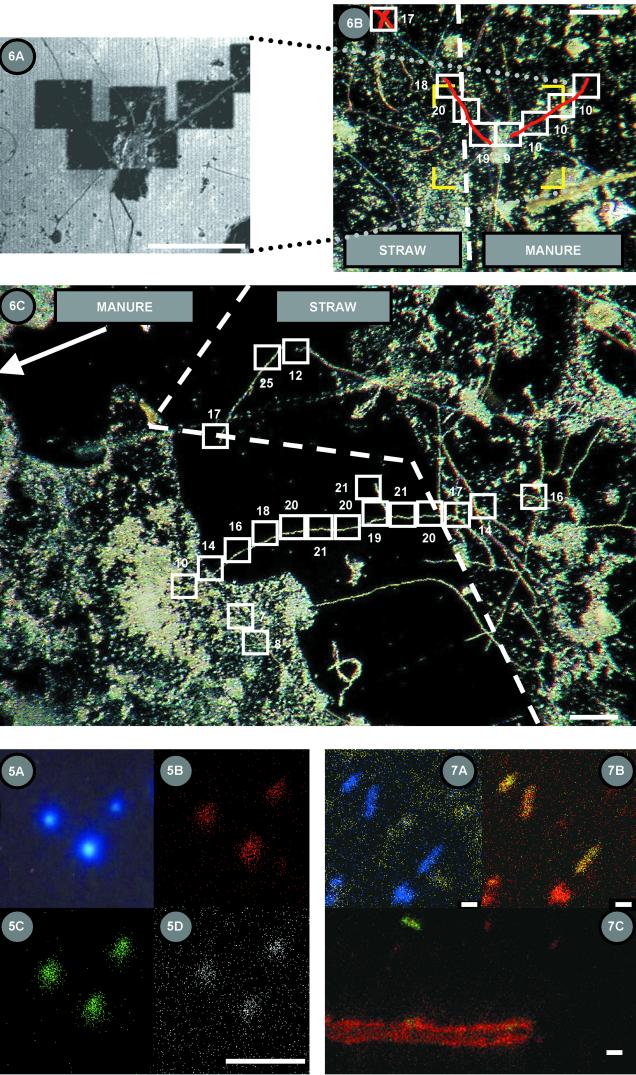
FIG. 6.
Secondary electron image (A) and light micrographs (B and C) of Si contact slides that were in contact with a model soil system. The system consisted of a straw-manure interface on kaolinite to which 15NO3− was added. The area in panel A is bracketed in yellow in panel B. Dark, electron-poor sputtered areas in panel A are represented by white boxes in panel B. The values adjacent to the analysis areas are the 15N contents (atoms percent) of the region of interest of the fungal hyphae (shaded red). The dashed line represents the straw-manure interface. (C) Light micrograph of an Si contact slide illustrating microsite heterogeneity of differential 15N assimilation by fungal hyphae growing across a model soil microsite. The arrangement is similar to that of panel B, except that the dashed line represents the straw boundary and the manure boundary is about 10 μm left of and parallel to the panel boundary. Bars, 100 μm.

