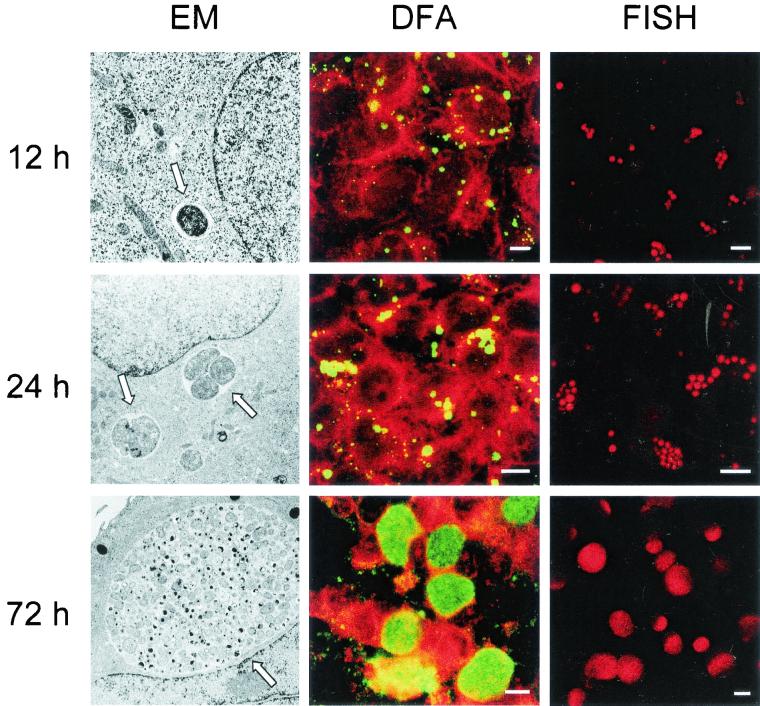
FIG. 6.
Visualization of the developmental cycle of C. pneumoniae by FISH (using Cy3-labeled probe Cpn-214; FISH column) and comparison with electron microscopy (EM column) and DFA staining (using fluorescein-labeled antichlamydia antibodies; DFA column). Three different points of time postinfection are shown. Arrows, chlamydial inclusions. Bars, 10 μm.

