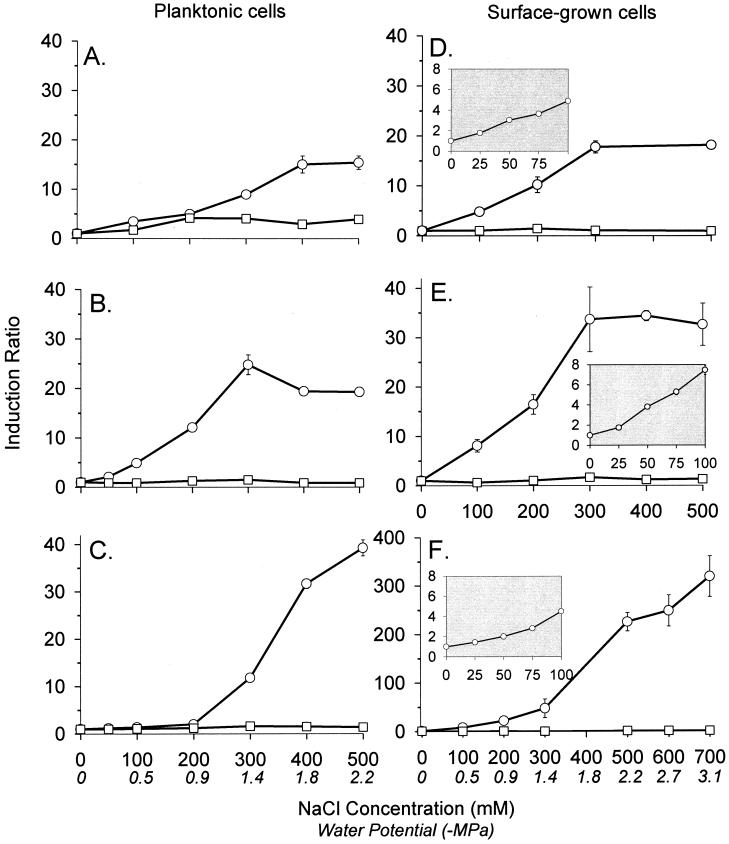
FIG. 2.
Induction of PproU-gfp in cells that were grown in 1/2-21C broth (A, B, and C) or on 1/2-21C plates (D, E, and F) containing various concentrations of NaCl. (A and D) E. coli DH5α(pPProGreen) (○) and DH5α(pVLacGreen) (□); (B and E) P. agglomerans BRT98(pPProGreen) (○) and BRT98(pVLacGreen) (□); (C and F) P. syringae B728a(pPProGreen) (○) and B728a(pPNptGreen) (□). The insets show induction over a narrower range of NaCl concentrations. The fluorescence of the cells was measured with a fluorometer. The induction ratio was the mean fluorescence of the cells relative to the mean fluorescence of cells grown with 0 mM NaCl. Values represent the mean ± standard error of the mean (n = 3).

