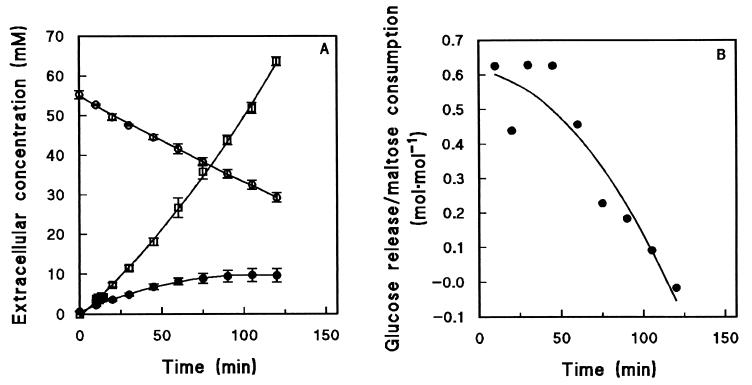
FIG. 2.
Anaerobic fermentation of maltose by cells harvested from an aerobic, maltose-limited chemostat culture of S. cerevisiae CEN.PK113-7D and subsequently exposed to excess maltose. The values are averages ± mean deviations for three experiments with cells from independent chemostat cultures. (A) Extracellular metabolite concentrations as determined by pulse assays of three independent cultures. Symbols: ○, maltose; •, glucose; □, ethanol. (B) Amount of glucose released per mole of maltose consumed during the anaerobic maltose fermentation experiment, calculated by dividing the slopes of the glucose and maltose curves in panel A.

