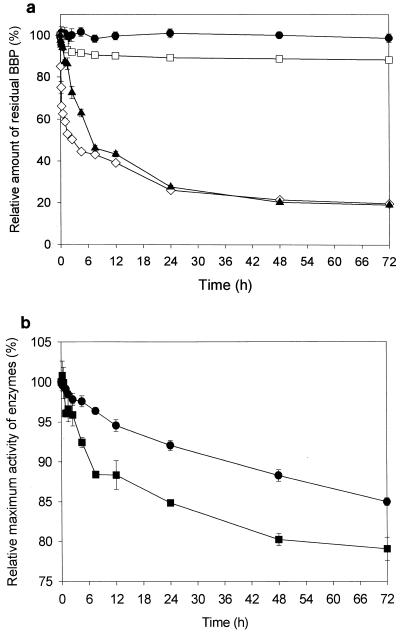
FIG. 1.
(a) Time-course variation in the residual amount of BBP, expressed in terms of relative amount (i.e., initial BBP amount = 100%), during the enzymatic degradation of BBP. •, BBP (500 mg liter−1) in Tris-HCl buffer (10 mM, pH 8.0) without enzyme; □, BBP (500 mg liter−1) degraded by esterase (10 mg liter−1); ▴, BBP (500 mg liter−1) degraded by esterase (100 mg liter−1); ⋄, BBP (500 mg liter−1) degraded by cutinase (10 mg liter−1). (b) PNB hydrolysis activities of cutinase (•) and esterase (▪), expressed in terms of relative activity (i.e., maximum PNB hydrolysis activity by the initial sample = 100%), contained in various time-course samples taken during the enzymatic degradation of BBP.

