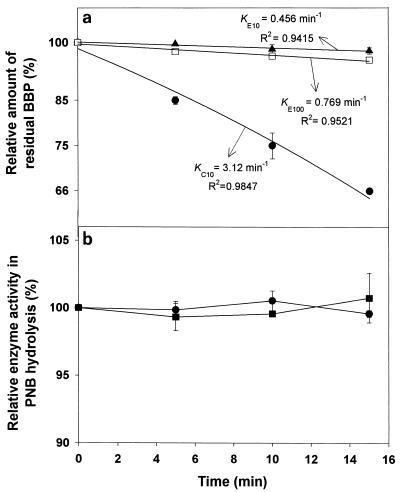
FIG. 2.
(a) Semilogarithmic plot of time-course variation in the amount of relative residual BBP during the initial 15 min after the start of enzymatic degradation by cutinase (10 mg liter−1) (•) and esterase (10 mg liter−1 [▴] or 100 mg liter−1 [□]). KC10, KE10, and KE100 represent the degradation constants in the first-order degradation kinetics of BBP resulting from the action of 10-mg/liter cutinase and 10- and 100-mg/liter esterase, respectively. (b) Time-course variation, for the initial 15 min, in the PNB hydrolysis activities of cutinase (10 mg liter−1) (•) and esterase (100 mg liter−1) (▪).

