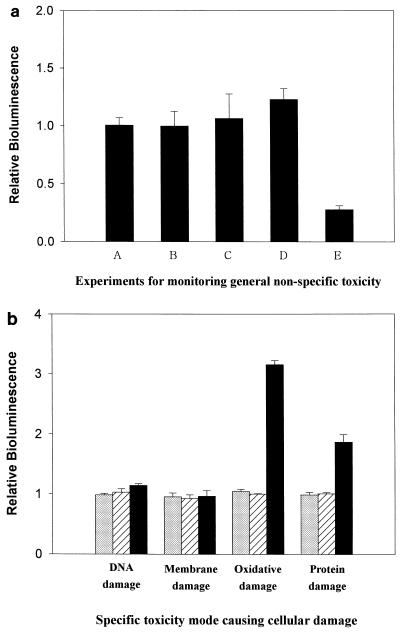
FIG. 6.
(a) Results of estimation of relative BL by using strain GC2, showing the general toxicity (i.e., nonspecific cellular stress) of the test samples: A, Tris-HCl buffer containing BBP (500 ppm); B, Tris-HCl buffer containing cutinase (100 mg liter−1); C, Tris-HCl buffer containing esterase (100 mg liter−1); D, final products of BBP degradation by cutinase; and E, final products of BBP degradation by esterase. (b) Results of the estimation of relative BL, using strains DPD2794, TV1016, DPD2511, and DPD2540, showing the specific mode of toxicity of the test samples, i.e., Tris-HCl buffer containing BBP (500 ppm) (gray columns) and the final products of BBP degradation by cutinase and esterase (striped and black columns, respectively).

