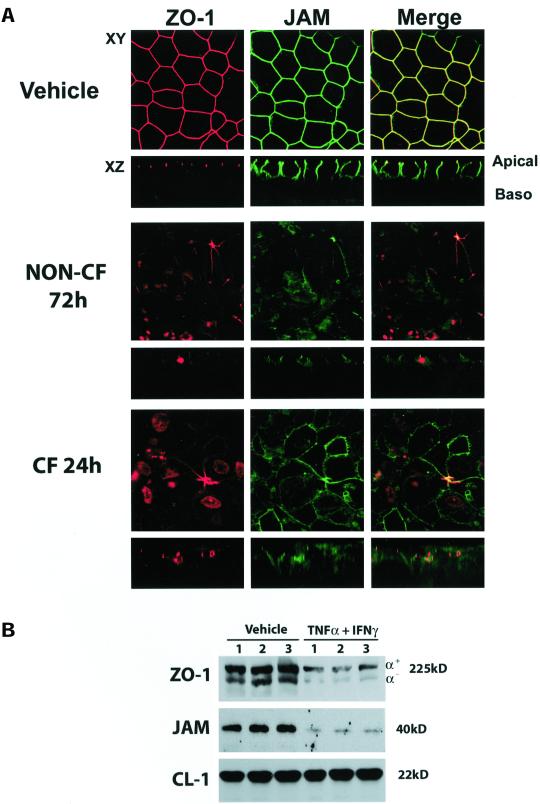
Figure 5.
Effect of TNF-α and IFN-γ treatment on expression and localization of JAM and ZO-1. (A) Immunofluorescent staining for JAM and ZO-1 in non-CF and CF primary HAE cells exposed to TNF-α and IFN-γ for 72 or 24 h. Red staining (left) represents ZO-1, green staining (middle) is JAM, and (right) merged image of both ZO-1 and JAM. Areas of colocalization appear as yellow. Images are representative of a minimum of n = 6 cultures from two patients. (B) Western blotting of ZO-1 (top) and immunoprecipitation of JAM (middle) in non-CF cultures. Western blot for ZO-1 was stripped and reprobed with an antibody specific for claudin-1 to control for loading (bottom).

