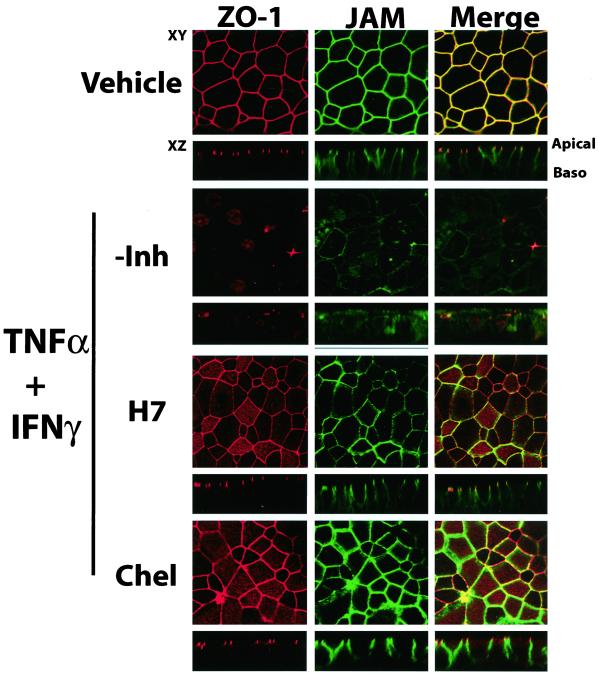
Figure 9.
Effect of H7 and chelerythrine on the reorganization of ZO-1 and JAM. Immunofluorescent staining for JAM and ZO-1 in primary HAE cells exposed to TNF-α and IFN-γ for 72 h in the presence or absence of H7 (10 μM) or chelerythrine (10 μM). Red staining (left) represents ZO-1, green staining (middle) is JAM, and right is a merged image of both ZO-1 and JAM. Areas of colocalization appear yellow.

