

Abstract
Natural killer (NK) and natural killer T (NKT) cells are two important cell subsets of the innate immune system. NK and NKT cells share many phenotypes and functions for anti-tumor immunity; however, the dynamic changes in phenotypes and functional interactions within the tumor microenvironment during tumor development and progression are unknown. Here we report that NK and NKT cells have distinct properties, metabolic profiles, and functions during tumor development. Using the mouse E0771 breast cancer and B16 melanoma models, we found that both NK and NKT cells are dynamically involved in the immune responses to cancer but have distinct distributions and phenotypic profiles in tumor sites and other peripheral organs during the course of tumor development and progression. In the early stages of tumor development, both NK and NKT cells exhibit effector properties. In the later cancer stages, NK and NKT cells have impaired cytotoxic capacities and dysfunctional states. NK cells become senescent cells, while NKT cells, other than invariant NKT (iNKT) cells, are exhausted in the advanced cancers. In contrast, iNKT cells develop increases in activation and effector function within the breast tumor microenvironment. In addition, senescent NK cells have heightened glucose and lipid metabolism, but exhausted NKT cells display unbalanced metabolism in tumor microenvironments of both breast cancer and melanoma tumor models. These studies provide a better understanding of the dynamic and distinct functional roles of NK and NKT cells in anti-tumor immunity, which may facilitate the development of novel immunotherapies targeting NK and NKT cells for cancer treatment.
INTRODUCTION
Current immunotherapy strategies including immune checkpoint blockage therapy have resulted in promising results in certain types of cancer patients, but these strategies have so far been insufficient in reproducibly eliminating breast tumors [1–3]. It is clear that different types of immune cells are suppressed and dysfunctional in the suppressive tumor microenvironment, which is a major obstacle for successful tumor immunotherapy [4–7]. Thus, a better understanding of the dynamic roles and functional states of immune cells in cancers is essential for the development of novel strategies to treat cancer patients. NK and NKT cells are two key lymphocyte subsets in innate immunity. Although they share many common phenotypes and functions during their anti-tumor and pathogen-infectious responses, they are different based on their distinct lineage development, antigen recognition, tissue distribution, and unique regulatory mechanisms in both physiological and pathological conditions [8–10]. NK cells are a subset of cytotoxic innate lymphoid cell regulated by activation and inhibition signals from membrane receptors [11]. Furthermore, NK cells can be characterized into different subsets with distinct functions by their unique surface molecule expressions. In humans, the CD56dimCD16+ subsets represent the most peripheral blood NK cell populations and have a greater cytotoxicity, while CD56hiCD16− subsets lack perforin and perform immune regulatory functions [12]. In mice, CD27hi NK cells have potent cytotoxic capacity, while CD27low NK cells are regulatory cells [13]. In addition, CD27 and CD11b double-positive human NK cells are more mature and highly cytotoxic [14]. NKT cells are a unique T-cell subset. Unlike conventional T cells, NKT cells recognize lipid antigens in a CD1d-dependent (Type I and Type II) or independent manner [8, 15]. Most studied NKT populations are type I NKT cells (also known as iNKT cells), which express the invariant Vα14Jα18 TCR in mouse or Vα24Jα18 in human and recognize a-GalCer lipid antigen [8, 16]. Recent studies from pre-clinical animals and clinical trials suggest that both NK and NKT cells have effective and potent anti-tumor activity, making them attractive targets for immunotherapy to treat patients with malignancies [8, 17–21].
In addition to performing immune surveillance important for prevention of tumor development, accumulating evidence indicates that NK cells are dysfunctional or anergic in the tumor microenvironment during cancer development [22–24]. Malignant tumors develop various strategies to reshape NK functions for anti-tumor immunity. NK cells develop immature phenotypes, downregulating the activating receptors and effector molecules NKG2D, NKp46, perforin and granzyme B, but upregulating the inhibitory receptor NKG2A, and reducing their cytotoxic activity for breast cancer and melanoma [25–27]. In addition, tumor microenvironments reprogram NK cells to develop an exhausted state with increased PD1 expression and decreased expressions of eomesodermin (EOMES) and T-bet [28–30]. Unlike NK cells, little information is known about NKT cells in the tumor microenvironment. However, recent studies clearly suggest that different types of NKT cells may have distinct functions during tumor development [16, 31–33]. Type I NKT cells mediate an effective anti-tumor activity, while type II NKT cells have regulatory functions inhibiting tumor immunity [16, 32]. Therefore, precise dissection of the functional differences and the dynamic roles of NK and NKT cells in cancer development and progression is a key for clinical application of novel immunotherapeutic strategies targeting NK and NKT cells in human cancers.
Increasing evidence suggests that the development of senescence in immune cells is another important functional state in the tumor microenvironment. Significant accumulation of senescent CD8+ T cells has been found in the tumor sites from various types of cancer patients [34–36]. We have demonstrated that multiple types of tumors, including breast cancer and melanoma, can directly induce T-cell senescence [37, 38]. Furthermore, naturally occurring human CD4+ Treg and tumor-derived Treg cells can trigger cell senescence and DNA damage in responder T cells through glucose consumption during their cross-talk [39–41]. In addition, these senescent T cells are functionally suppressive and molecularly distinct from anergic and exhausted T cells in tumor microenvironments [37, 39–42]. These studies identify an important mechanism responsible for immune cell dysfunction within the tumor microenvironment. However, whether the tumor microenvironment also directs NK and NKT cells to become senescent cells during tumor progression is unclear and must be explored urgently in order to develop effective immunotherapies.
In our efforts to understand the functional roles of NK and NKT cells in immune pathogenesis of cancer development, we first used the mouse E0771 breast cancer model to mimic different clinical stages of human breast cancer and characterized the dynamic distributions and qualities of NK and NKT cells in different organs and tumors associated with tumor progression [43]. We found that NK and NKT cells have distinct distributions and phenotypic profiles in different tissues, but undergo similar changes in the tumor microenvironment during E0771 breast cancer development and progression. In the late cancer stage, NK cells from breast cancer E0771-bearing mice become senescent cells with impaired functions. However, NKT cells (but not iNKT cells) recovered from breast cancer E0771 tumor-bearing hosts display an exhausted state, while iNKT cells become hyperactivated with potent effector functions in breast cancer. In addition, senescent NK cells, but not exhausted NKT cells, in the breast tumor microenvironment, have active glucose and lipid metabolism. Furthermore, we observed the similar properties and functions of NK and NKT in the B16F0 melanoma tumor model as shown in the E0771 breast cancer model. Importantly, we identified that tumor cells control the fate of immune cells, directly promoting NK cell senescence and dysfunction. These results collectively suggest that NK and NKT cells exhibit different properties and functions important for dynamic tumor development and progression.
RESULTS
NK and NKT cells have distinct distributions among organs but with a similar changing trend in the tumor microenvironment during breast cancer development and progression
To determine the role and dynamic distributions of NK and NKT cells during the tumor progression, we utilized breast adenocarcinoma E0771 cell line to establish the breast cancer model in C57BL/6 mice to mimic spontaneously developed breast cancer [43]. Furthermore, varied tumor sizes instead of growth times were utilized for the study time points to mimic different tumor stages of cancer progression in the clinical cancer patients in this study (Fig. 1A) [43]. Using this breast cancer model, we have previously characterized both CD4+ and CD8+ T cells in the tumor-bearing mice and identified that CD4+ and CD8+ T cells have opposing roles in breast cancer progression and outcome [43]. To further explore functional roles of NK and NKT cells in the immune pathogenesis of breast cancer development, we analyzed the numbers and proportions of NK and NKT cells in the different organs and tumor sites when tumor volumes reached the indicated sizes shown in Fig. 1A after tumor challenge.
Fig. 1. Distinct distributions of NK and NKT cells in the breast cancer E0771 tumor-bearing mice during the tumor development and progression.
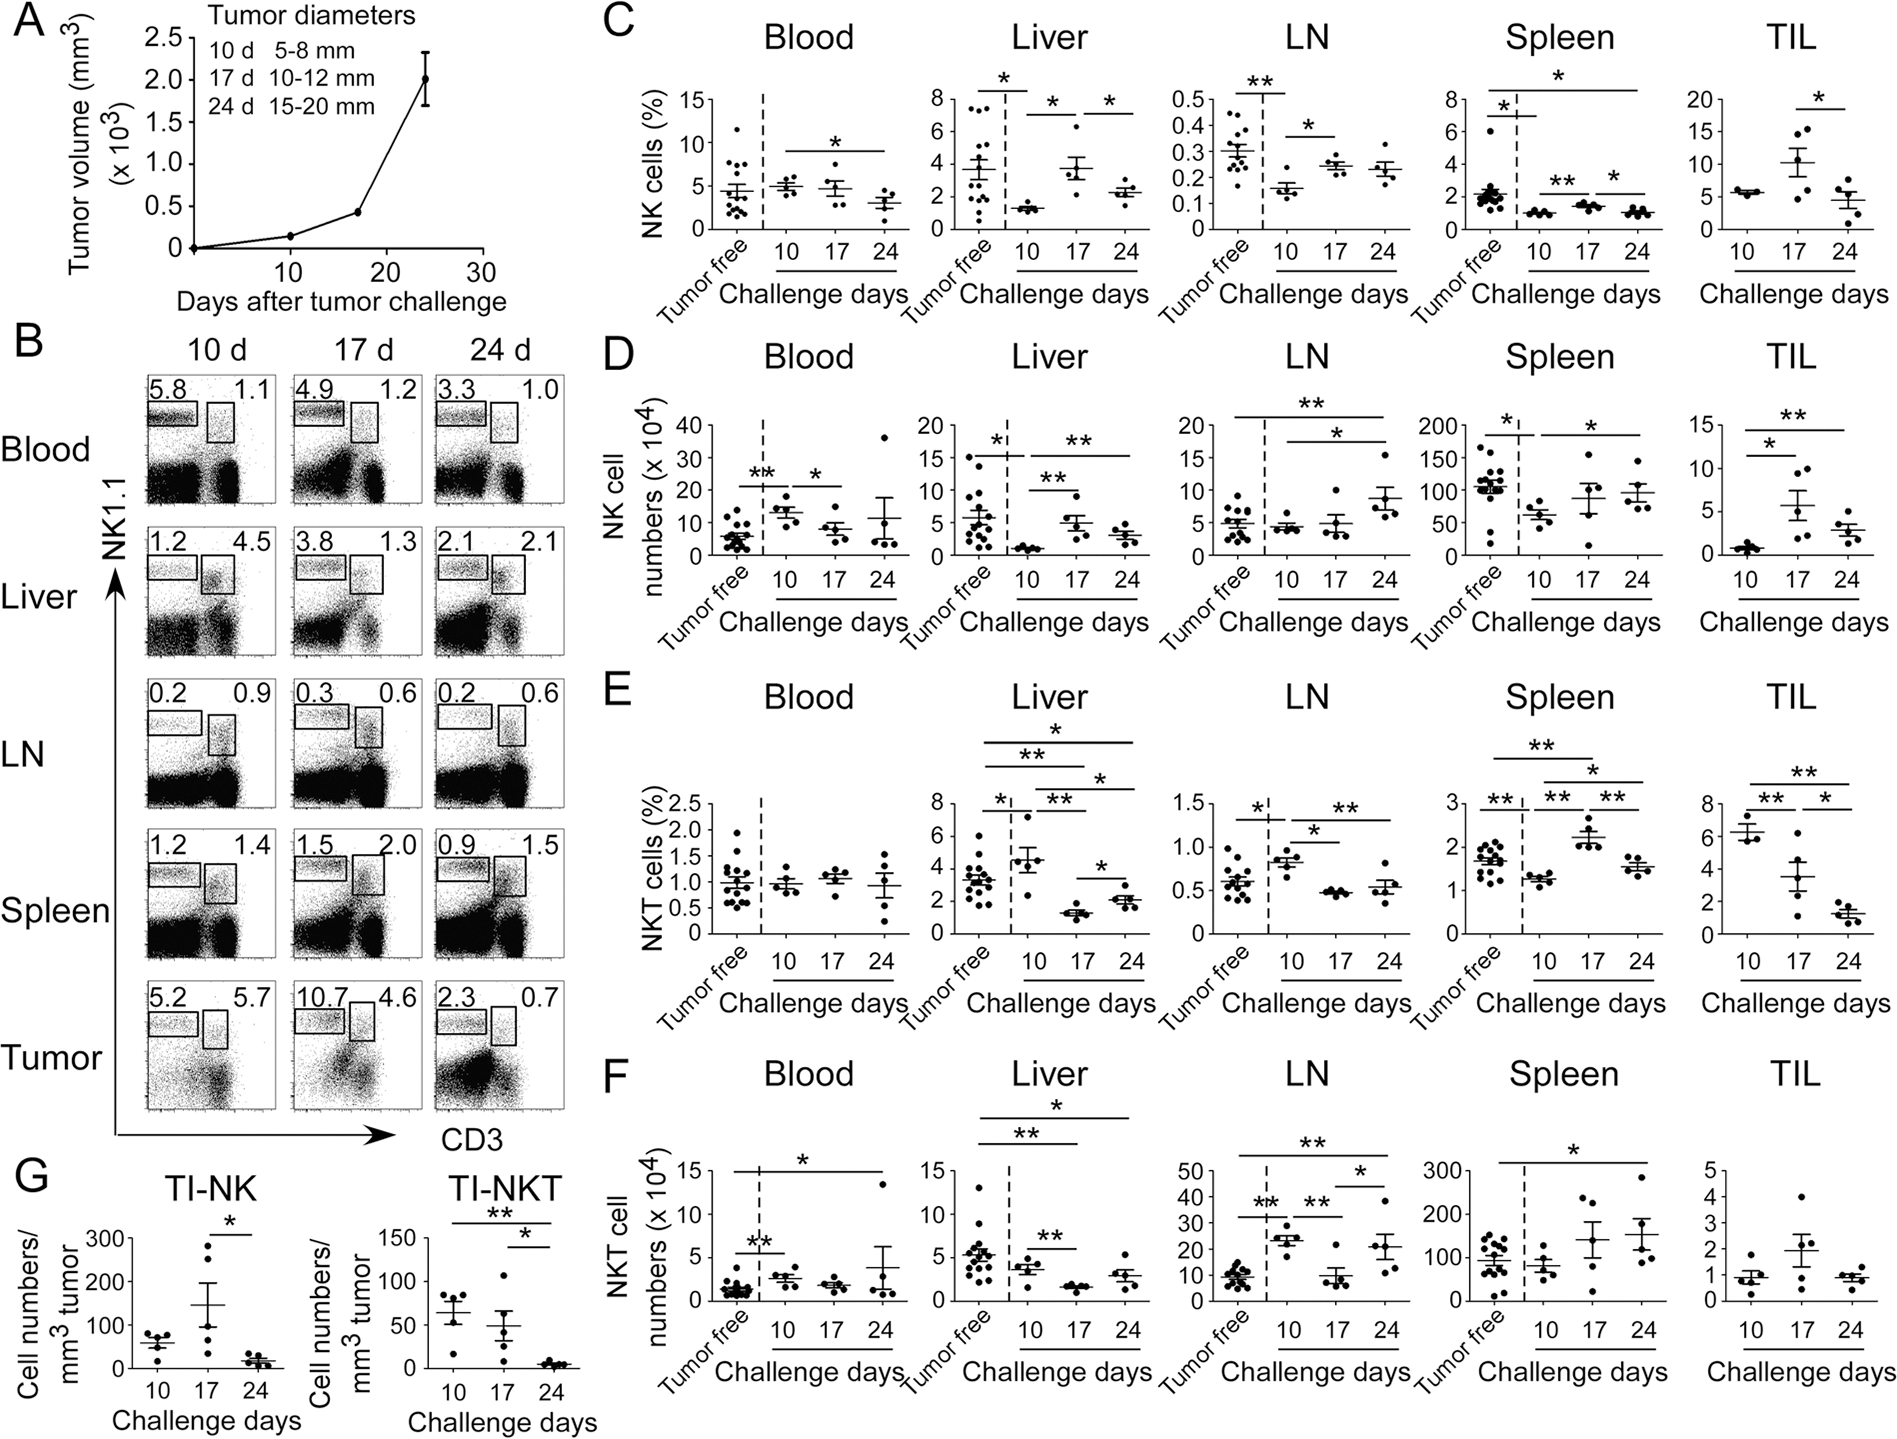
A Tumor growth curve of mouse breast cancer E0771 cells was determined based on tumor sizes. E0771 (2 × 10⁵ cells/mouse) were implanted into mammary gland fat pads of female C57BL/6 mice (n = 5). When primary tumors reached indicated sizes, tumor-bearing mice and tumor-free-littermate controls were sacrificed, and mononuclear cells from different organs and tumors were isolated and cell proportions and numbers analyzed. B Results shown are the representative results of NK (CD3−NK1.1+) and NKT (CD3+NK1.1+) cell proportions in different organs and tumor from one tumor-bearing mouse at the indicated time points using flow cytometry analyses. The proportions (in C) and absolute cell numbers (in D) of NK cells in blood, livers, lymph nodes (LN), spleens, and tumors were analyzed at the indicated time points using flow cytometry analyses. The result of each dot shown is derived from an individual mouse. Data shown are mean ± SD from five tumor-bearing mice in each time point. *p < 0.05 and **p < 0.01. Paired (groups within tumor-bearing mice) or unpaired (groups between tumor-free and tumor-bearing mice) student’s t tests were performed. The proportions (in E) and absolute cell numbers (in F) of NKT cells in blood, livers, lymph nodes, spleens, and tumors were analyzed at the indicated time points using flow cytometry analyses. The result of each dot shown in (E) and (F) is derived from an individual mouse. Data shown are mean ± SD from five tumor-bearing mice in each time point. *p < 0.05 and **p < 0.01. Paired (groups within tumor-bearing mice) or unpaired (groups between tumor-free and tumor-bearing mice) student’s t tests were performed. G Relative cell numbers of tumor-infiltrating NK (TI-NK) and NKT (TI-NKT) cells with the tumor progression were calculated based on their absolute cell numbers per tumor volume in each tumor tissue. The result of each dot shown is derived from an individual mouse. Data shown are mean ± SD from five mice in each time point. *p < 0.05 and **p < 0.01 between the indicated two groups determined by paired student’s t test.
We found that cell proportions of NK cells were high in the tumor-infiltrating lymphocytes (TILs) compared with that of NK cells recovered from the peripheral organs, including blood, liver, spleen (SP), and lymph node (LN), from both tumor-free control and tumor-bearing mice (Fig. 1B, C). Furthermore, increased absolute numbers of NK cells were observed in the early stages of tumor progression (day 10) in blood in the E0771 tumor-bearing mice than those of tumor-free mice (Fig. 1D). However, both cell proportions and absolute numbers of NK cells in blood were decreased with the increasing tumor size and progression (Fig. 1C, D). In addition, the fractions and absolute numbers of NK cells in liver in the tumor-bearing mice were markedly decreased compared with those in tumor-free control mice (Fig. 1C, D). Notably, we found the trends of both fractions and numbers of NK cells in liver and in TILs were significantly increased in the early stages of E0771 tumor progression (from day 10 to day 17), and then decreased with the advanced tumor stages. However, both the fractions and absolute numbers of NK cells in LNs in the tumor-bearing mice were markedly increased with tumor development and progression (Fig. 1C, D). These results suggest that NK cells are dynamic in different organs and tumor sites during tumor progression to perform their immune responses.
Similar to NK cells, the cell fractions of NKT cells among TILs were also high compared with that in the other organs of liver, blood, SP, and LN (Fig. 1B, E). However, unlike NK cells, the fractions of NKT cells in SP and LN were generally higher than that of respective organ in the tumor-free mice during the tumor developmental stages and progression in E0771 cancer (Fig. 1E, F). Furthermore, the fractions and absolute numbers of NKT cells in blood were kept similar levels between tumor-free and E0771 tumor-bearing mice (Fig. 1E, F). In addition, the overall trend of NKT cells in liver was decreased with the tumor progression. However, the trend of NKT cells in LN was increased in the early stage and then decreased with the tumor progression.
To exclude the possibility that increased absolute NK and NKT cell numbers are due to the enlarged tumors, the relative cell numbers per tumor volume of NK and NKT cells were further determined at different tumor stages of E0771 (Fig. 1G). We observed consistent trends as shown in the absolute numbers that relative cell numbers of NK and NKT cells were also high at day 10 and day 17 time points in E0771 tumor-bearing mice during the E0771 cancer development and the gradually decreased during the course of tumor progression (day 24) (Fig. 1G). Notably, both NK and NKT cells were significantly reduced at the advanced stage of tumors, indicating dysfunctional role of NK and NKT cells in the tumor microenvironment. In addition, NK and NKT cells have the similar trends to tumor-infiltrating CD8+ T cells within the tumor microenvironment, suggesting that they may have same functional roles for anti-tumor immunity in breast cancer [43]. Collectively, although NK and NKT cells have different distributions and trends in the organs, they have a very similar trend in the tumor microenvironment during breast cancer development and progression.
NK cells in the breast cancer-bearing host are immature with impaired functions
It has been shown that NK cells are functionally impaired in cancers [25–27]. Therefore, we explored the maturation and functional states of NK cells in the late cancer stage (day 24) in E0771-bearing mice. NK cells can be classified into four distinct subsets of maturation based on CD27 and CD11b expression [13]. CD27 and CD11b double-positive NK cells are considered as mature NK cells with high activity [14]. We observed that NK cells had increased immature populations (CD11b−CD27− and CD11b−CD27+) but had decreased mature populations in the TILs of E0771 tumor-bearing mice compared with NK cells in the peripheral organs in the tumor-free control mice (Fig. 2A). In addition to the tumors, similar maturation profiles of NK cells with increased immature proportions and reduced mature fractions in the LNs and SPs were observed in the tumor-bearing mice compared with those in the tumor-free mice. Notably, there were no much differences of NK mature states in blood and livers between tumor-bearing and tumor-free mice (Fig. 2A).
Fig. 2. Characteristics of NK cells in the breast cancer E0771 tumor-bearing mice.

A CD11b and CD27 expressions in NK cells (gating CD3−NK1.1+) from different organs and TILs were determined at day 24 after tumor challenge using flow cytometry analyses. The result of each dot shown is derived from an individual mouse. Data shown are mean ± SD from five mice in each time point. *p < 0.05 and **p < 0.01 with paired student’s t test. ##p < 0.01, compared with the NK cells in blood from tumor-free mice by unpaired student’s t test. B Expression levels of the functional receptors in NK cells from different organs and TILs were determined at day 24 after tumor challenge using flow cytometry analyses. *p < 0.05 and **p < 0.01 with paired student’s t test (n = 5 mice in each time point). ##p < 0.01, compared with the NK cells in blood from tumor-free mice analyzed by unpaired student’s t test. C IFN-γ production and effector molecule expression of NK cells from different organs and TILs in tumor-bearing mice were determined at day 24 after tumor challenge using flow cytometry analyses. NK cells were performed intracellular staining after stimulation with PMA and ionomycin for 5 h. *p < 0.05 and **p < 0.01 with paired student’s t test. ##p < 0.01, compared with the NK cells in blood from tumor-free mice analyzed by unpaired student’s t test. D Expression levels of transcription factors in NK cells from different organs and TILs were determined at day 24 after tumor challenge using flow cytometry analyses. *p < 0.05 and **p < 0.01 with paired student’s t test. E Dynamic changes of perforin, Grzm B and IFN-γ in the tumor-infiltrating NK (TI-NK) cells in E0771 tumor-bearing mice with the tumor development. Cell preparation and analyses were identical as described in (C). Result of each dot shown is derived from an individual mouse. *p < 0.05 and **p < 0.01 with unpaired student’s t test. F NK cells from tumor-bearing mice had impaired cytotoxic activity. NK cells were purified from blood of E0771 tumor-bearing mice at day 24 after tumor challenge, and then co-cultured with the calcein-labeled target YAC-1 cells at the indicated ratios for 4 h. Blood NK cells from tumor-free mice were included as a control. Calcein releases in target cells from different groups were determined and NK cytotoxicity was calculated. Data shown are mean ± SD from five mice. *p < 0.05 and **p < 0.01 compared with blood NK cells from tumor-bearing mice determined by paired student’s t test.
NK cell recognition and destruction of tumor cells are regulated by the balance of activating and inhibitory receptors, including NKp46, NKG2D, and NKG2A [25]. We reasoned that NK cells may have altered expression of these receptors in the tumor-suppressive microenvironment. As expected, we observed the tumor-infiltrating NK (TI-NK) cells exhibited significantly upregulated the inhibitory receptor NKG2A but downregulated activating receptors NKG2D and NKp46 in the late stage of E0771 development (Fig. 2B). Furthermore, decreased expressions of NKG2D in LNs and NKp46 in livers and LNs were also showed in the tumor-bearing mice compared with those in tumor-free mice. However, there were no obvious changes of the other activation markers CD44, CD69, CD122, and DX5 (CD49b), in NK cells from different organs at the late stage of tumor development between the tumor-bearing and tumor-free mice (Supplementary Fig. S1A).
We next examined the production of the effector molecules IFN-γ, perforin and granzyme B of NK cells in the tumor microenvironment. High frequencies of IFN-γ producing cell populations in NK cells in the blood, livers, LNs, and SPs, were found in both tumor-bearing and tumor-free control mice (Fig. 2C). Furthermore, tumor-infiltrating NK cells also produced high level of IFN-γ. However, IFN-γ-producing cell populations were significantly decreased in the NK cells from blood, LNs, and SPs in the tumor-bearing mice compared with those in respective organs in tumor-free mice (Fig. 2C). However, there were no obvious changes of perforin and granzyme B in NK cells from different organs between the tumor-bearing mice at the late stage of tumor development and tumor-free mice, except the decreased perforin expression in the tumor-infiltrating NK cells (Fig. 2C). In parallel, expression levels of transcription factors EOMES and T-bet in NK cells were also decreased in the different organs and TILs in the tumor-bearing mice compared with tumor-free mice (Fig. 2D). We also observed that expression levels of IFN-γ, granzyme B and perforin of tumor-infiltrating NK cells were dynamic, which were increased in the early stages of E0771 development and then decreased during the course of tumor progression (Fig. 2E). In addition, NK cells purified from blood of tumor-bearing mice had a markedly decreased cytotoxic activity (Fig. 2F). These data collectively suggest that NK cells become immature phenotypes with impaired function in the late stage of E0771 breast tumor development.
NKT cells in breast cancer exhibit a distinct phenotypic profile with NK cells
To determine the activation status of NKT cells, we found that NKT cells exhibit a relatively activated phenotype with high expression of CD44, CD69, and CD122 molecules in the different organs of both tumor-free and tumor-bearing mice (Supplementary Fig. S1B). Furthermore, tumor-infiltrating NKT cells also showed high levels of these activation markers, suggesting potentially activated NKT cells in the tumor microenvironment. We next explored the activating and inhibitory receptors in NKT cells. We found that tumor-infiltrating NKT cells also exhibited high level of inhibitory receptor NKG2A, but had low levels of activating receptors NKG2D and NKp46, which are similar to tumor-infiltrating NK cells with immature and an inhibitory phenotype (Fig. 3A). Furthermore, NKT cells in blood, liver, LNs, and SPs expressed high activating receptors NKG2D in both tumor-free and tumor-bearing mice. In addition, levels of NKG2A in NKT cells in LNs were decreased from the tumor-bearing mice compared with tumor-free mice (Fig. 3A). The liver is a specific organ for NKT cells [9, 10]. We found that NKT cells in livers from tumor-berating mice were upregulated NKG2A but no changes of NKG2D and NKp46 compared with those in the tumor-free mice.
Fig. 3. Characteristics of NKT cells in the breast cancer E0771 tumor-bearing mice.
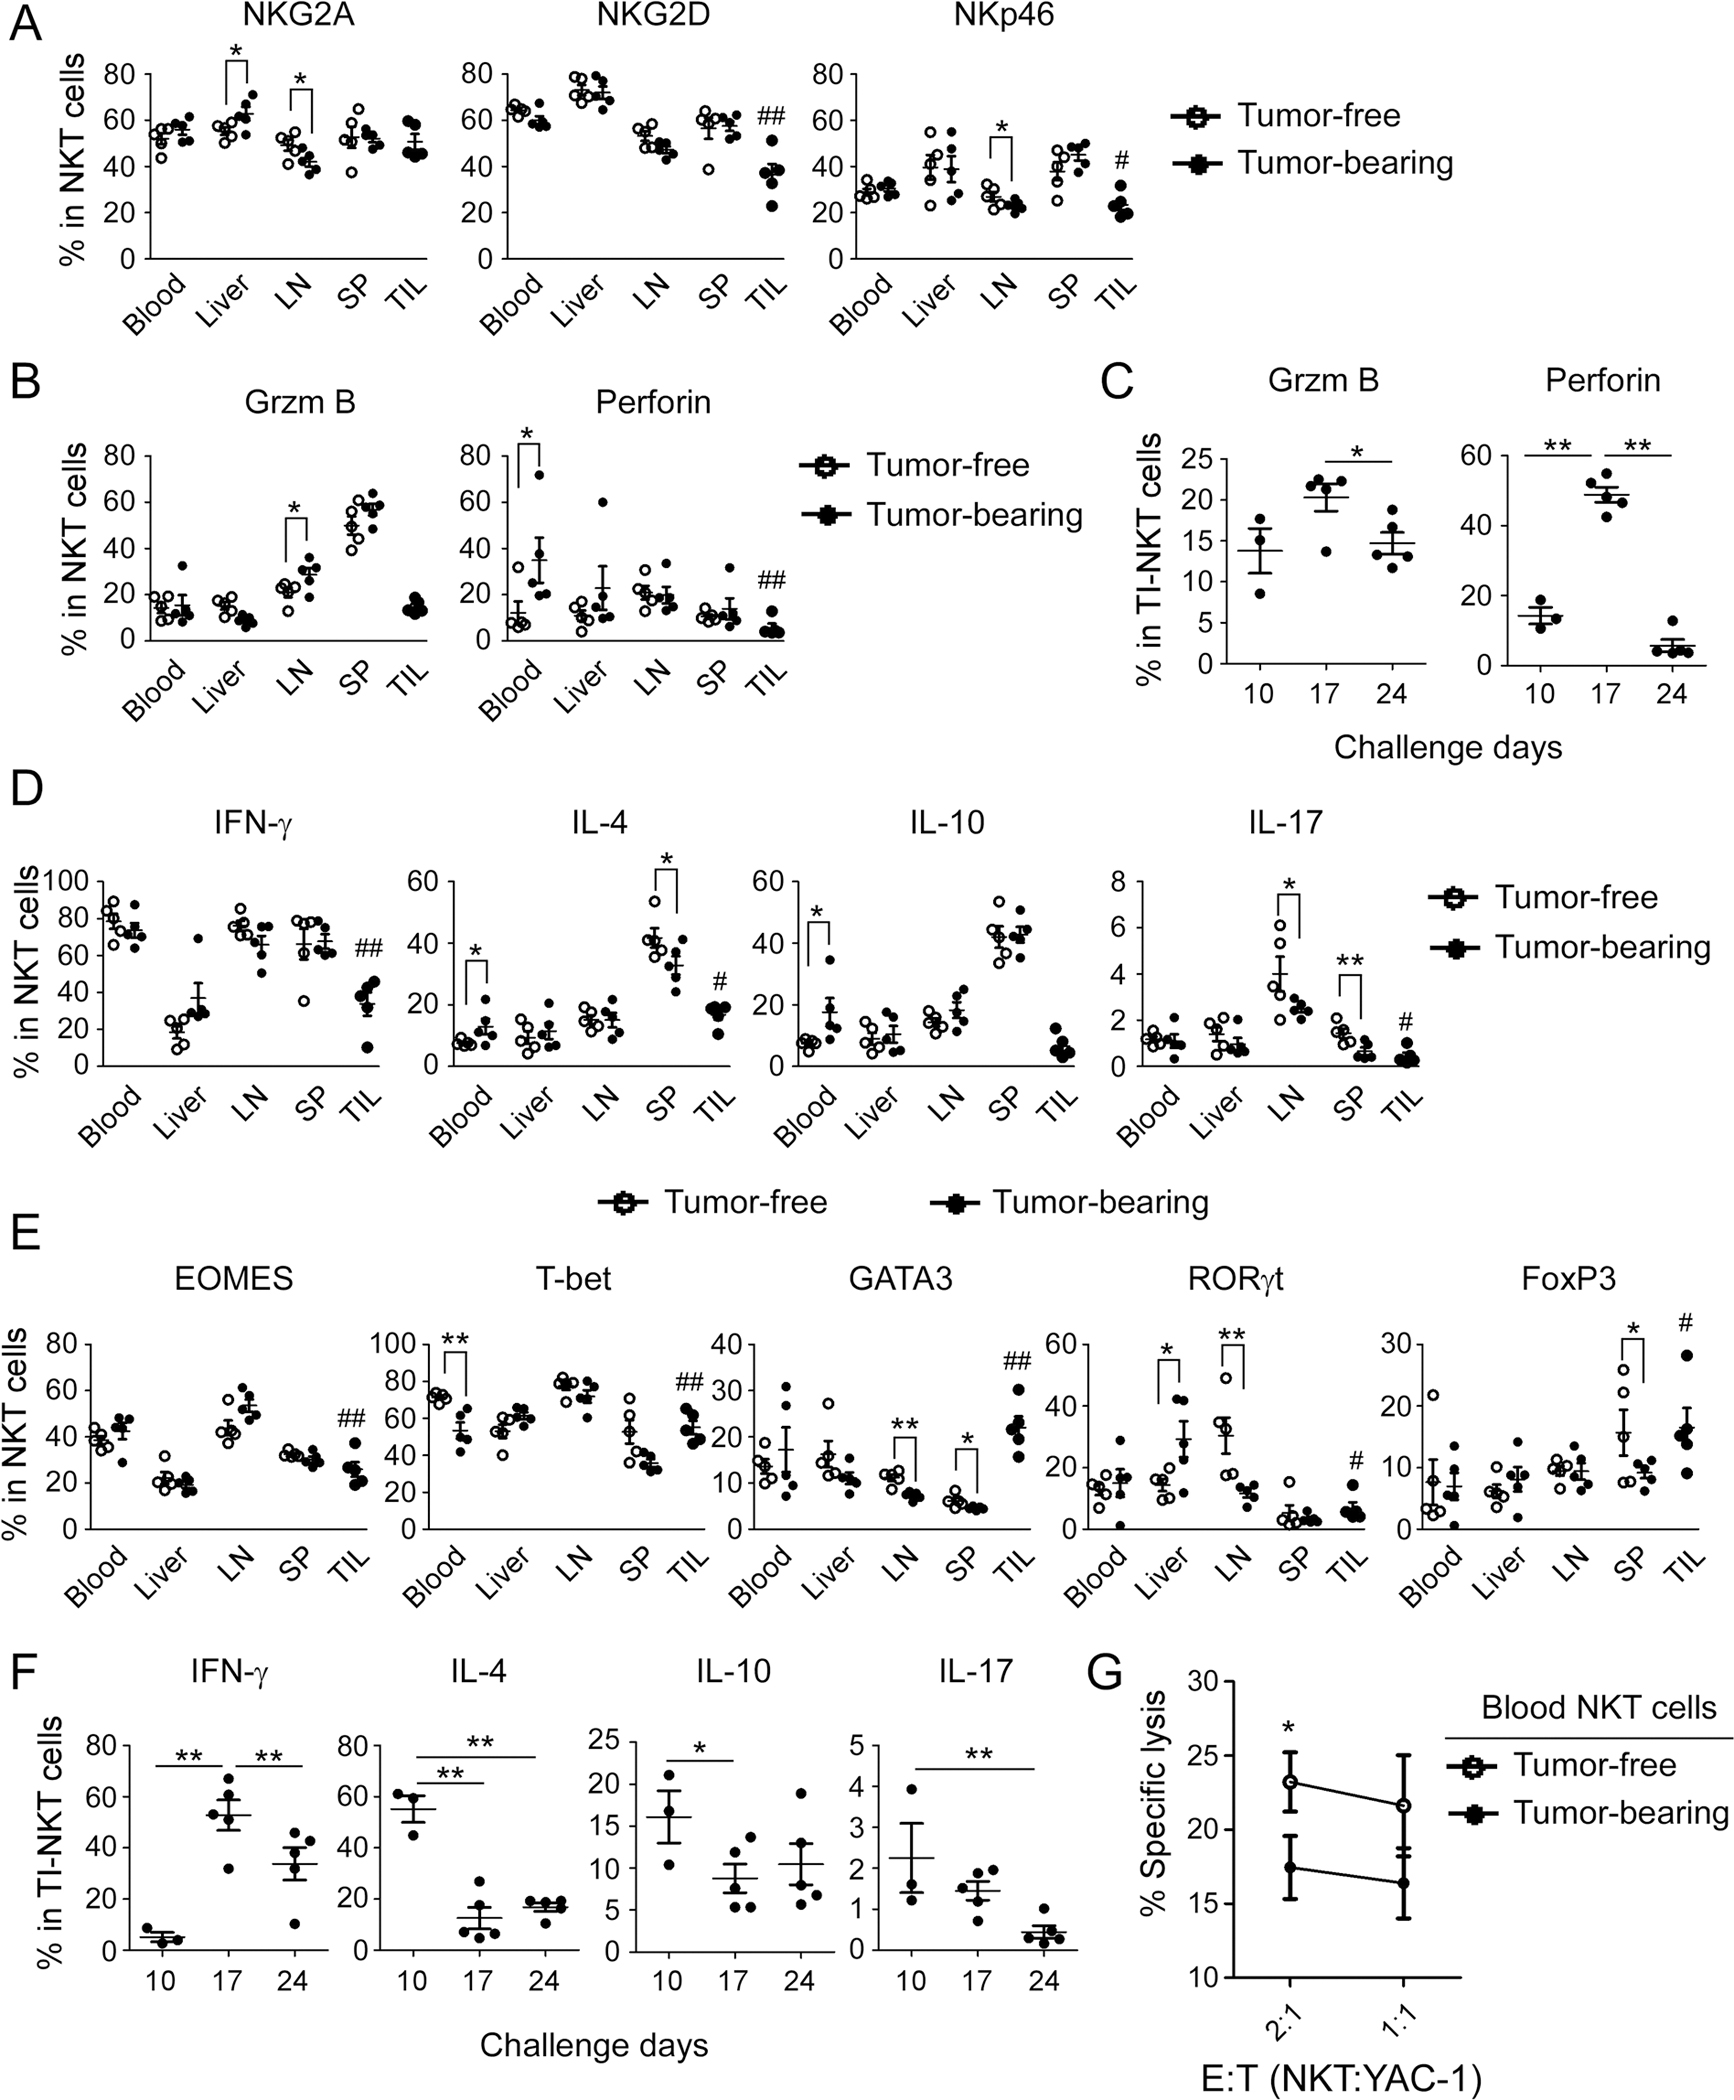
Expression levels of the functional receptors (in A) and effector molecules (in B) in NKT (gating CD3+NK1.1+) cells from different organs and TILs were determined at day 24 after tumor challenge using flow cytometry analyses. The result of each dot shown is derived from an individual mouse. Data shown are mean ± SD from five mice in each time point. *p < 0.05 with paired student’s t test. #p < 0.05 and ##p < 0.01, compared with the NKT cells in blood from tumor-free mice analyzed by unpaired student’s t test. C Dynamic changes of granzyme B and perforin in the tumor-infiltrating NKT (TI-NKT) cells in the tumor-bearing mice with tumor development. Cell preparation and analyses were identical as described in (A) and (B). The result of each dot shown is derived from an individual mouse. *p < 0.05 and **p < 0.01 with unpaired student’s t test. D Cytokine profiles of NKT cells in E0771 tumor-bearing mice. IFN-γ, IL-17, IL-4, and IL-10-producing NKT cell populations from different organs and TILs were determined at day 24 after tumor challenge using flow cytometry analyses. Intracellular staining of cytokines in NKT cells were performed after stimulation with PMA and ionomycin for 5 h. *p < 0.05 and **p < 0.01 with paired student’s t test. #p < 0.05 and ##p < 0.01, compared with the cytokine-producing NKT cells in blood from tumor-free mice analyzed by unpaired student’s t test. E Expression levels of transcription factors in NKT cells from different organs and TILs were determined at day 24 after tumor challenge using flow cytometry analyses. *p < 0.05 and **p < 0.01 with paired student’s t test. #p < 0.05 and ##p < 0.01, compared with the NKT cells in blood from tumor-free mice analyzed by unpaired student’s t test. F Dynamic changes of IFN-γ, IL-17, IL-4, and IL-10-producing NKT cell populations in the TI-NKT cells in the E0771-bearing mice were determined using flow cytometry analyses after stimulation with PMA and ionomycin for 5 h. The result of each dot shown is derived from an individual mouse. *p < 0.05 and **p < 0.01 with unpaired student’s t test. G NKT cells from tumor-bearing mice had decreased cytotoxic activity. NKT cells purified from blood of E0771 tumor-bearing mice at day 24 after tumor challenge were co-cultured with the calcein-labeled target YAC-1 cells at the indicated ratios for 4 h. Blood NKT cells from tumor-free mice were included as a control. Calcein releases in target cells from different groups were determined and NK cytotoxicity was calculated. Data shown are mean ± SD from five mice. *p < 0.05 compared with blood NKT cells from tumor-bearing mice determined by paired student’s t test.
We further investigated the effector functions of NKT cells in the E0771 tumor microenvironment. Similar to NK cells, there were no obvious changes of effector molecules granzyme B and perforin in NKT cells from different organs between the tumor-bearing mice at the late stage of tumor development and tumor-free mice, except that increased granzyme B in LN NKT cells and perforin in blood NKT cells were observed from tumor-bearing mice compared with the tumor-free mice (Fig. 3B). Furthermore, tumor-infiltrating NKT cells expressed decreased effector molecule granzyme B in the E0771 tumor-bearing mice (Fig. 3B). Notably, similar to NK cells, NKT cells had low levels of perforin in the different organs and tumors from tumor-bearing mice. To better understand these two effector molecule changes in the tumor-infiltrating NKT cells during the E0771 development and progression, we observed that tumor-infiltrating NKT cells produced certain amounts of perforin during the early and middle stages of tumor development and then significantly reduced in the advanced tumor stages. In contrast, NKT had low levels of granzyme B during all the states of tumor progression (Fig. 3C). These results suggest that granzyme B might be important for NK cells while perforin might be critical for NKT cells during their performing anti-tumor immunity, and that these two molecules have distinct dynamic trends during the course of tumor progression.
Activated NKT cells can rapidly secrete large amounts of cytokines, especially IL-4 and IFN-γ to perform their functions [44]. We then examined cytokine expression levels of NKT cells at the late stage of E0771 tumor development. We found that high levels of IFN-γ-producing NKT cells existed in blood, LNs, and SPs in both tumor-bearing and tumor-free control mice. Furthermore, significantly decreased IFN-γ-producing populations in the tumor-infiltrating NKT cells were observed in the late tumor stage of tumor-bearing mice (Fig. 3D). These results were consistent with the expression levels of the transcription factors EOMES and T-bet in NKT cells in the different organs and TILs in the tumor-bearing mice (Fig. 3E). Interestingly, NKT cells in livers had low levels of IFN-γ-producing and EOMES+ NKT populations in both tumor-free and tumor-bearing mice, further suggesting resting NKT cell populations in this special organ. Unlike NK cells, NKT cells produced certain amounts of cytokines of IL-4 and IL-10 in different organs (Fig. 3D). IL-4 and IL-10-producing populations were increased in blood NKT cells in the tumor-bearing mice compared with those in tumor-free mice. Furthermore, IL-4 production was at a certain level but IL-10-producing cells were at low levels in the tumor-infiltrating NKT cells. The expression changes of IL-4 and transcription factor GATA3 in NKT cells were consistent in both tumor-free and tumor-bearing mice. In addition, the overall IL-17-producing populations were very low in NKT cells in different organs from both tumor-bearing and tumor-free mice. IL-17-producing NKT cells in LNs, SPs and TILs were decreased in the tumor-bearing mice, which was consistent to the transcription factor RORγt expression in NKT cells (Fig. 3D, E). There were no significant changes of FoxP3+ NKT cells in blood, livers, and lLNs in both mice. However, FoxP3+ NKT cells were increased in TILs and decreased in SPs in the tumor-bearing mice (Fig. 3E). To further determine the dynamic changes of these cytokines in the tumor-infiltrating NKT cells, we found that these cytokine-producing NKT populations in the tumor microenvironment were initially increased at the tumor early stages and then decreased with the E0771 tumor development and progression (Fig. 3F). Although NKT cells from tumor-bearing mice highly expressed activation markers and secreted effector cytokines, NKT cells purified from blood of tumor-bearing mice still had a significantly reduced anti-tumor cytotoxicity, indicating their impaired anti-tumor capacity (Fig. 3G). These data clearly indicate that NKT cells have different phenotypes with NK cells in the breast cancer E0771 tumor-bearing mice, but both NK and NKT have impaired anti-tumor activities in the advanced tumor stage of breast cancer.
NKT cells except iNKT cells from breast cancer display an exhaustion state
To better understand the status and functions of NK and NKT cells in the breast tumor microenvironment, we determined the expression of the known exhaustion markers, including CTLA4, PD1 and Tim3, in these two cell types at the late cancer stage (at day 24) in the E0771-bearing mice. We observed that all these exhaustion markers were expressed in both NK and NKT cells but with distinct and variable levels (Fig. 4A, B). Unexpectedly, we did not observe significantly increased exhausted NK cell populations in the tumor-infiltrating NK cells in breast cancer, which only showed around or below 20% of CTLA4, PD1, and Tim3 positive cell populations in tumor-infiltrating NK cells (Fig. 4A). Furthermore, only slight increases of PD1 expression in SP and blood NK cells, and Tim3 expression in blood NK cells in the tumor-bearing mice compared with those in the tumor-free mice. In contrast, dramatically increased exhausted cell populations existed in the tumor-infiltrating NKT cells, which contain over 60% of cells positive for PD1 and Tim3, as well as 40% of CTLA4+ cells (Fig. 4B). These results suggest that NKT cells rather than NK cells are exhausted in the tumor microenvironment of E0771 breast cancer. In addition, slightly decreased CTLA4+ NKT cells in LNs but increased PD1+ NKT cells in liver and Tim3+ NKT cells in blood and SPs in the tumor-bearing mice compared with tumor-free mice (Fig. 4B). We further investigated how these inhibitory molecules change in both tumor-infiltrating NK and NKT cells in the tumor microenvironment. We found that the expression of all the three molecules in NK cells was maintained certain low levels with the tumor progression, but slight increases of PD1 and Tim3 expression in NK cells at the late stage of E0771 cancer development (Fig. 4C). However, all three exhaustion molecules maintained high levels in the tumor-infiltrating NKT cells during tumor progression of E0771 breast cancer (Fig. 4D). CTLA4 expression on tumor-infiltrating NKT cells was gradually decreased with the tumor progression. PD1 and Tim3 expressions in tumor-infiltrating NKT cells were at a very high level at the early stage of tumor development, then decreased with the increasing tumor progression, and increased again at the late stage of E0771 development (Fig. 4D). In addition, we analyzed the CTLA4, PD1, and Tim3 triple-positive cell populations in both tumor-infiltrating NK and NKT cells. The triple-positive cell populations of CTLA4, PD1, and Tim3 were significantly higher in tumor-infiltrating NKT cells than those in tumor-infiltrating NK cells (less than 10%) with the tumor progression, further indicating exhaustion of NKT cells (Fig. 4E). Collectively, these studies suggest that NKT cells but not NK cells become exhausted in the tumor microenvironment of E0771 breast cancer.
Fig. 4. NKT cells but not NK cells are exhausted in breast cancer E0771 tumor-bearing mice.

Expression levels of exhaustion markers CTLA4, PD1 and Tim3 in NK (in A) and NKT (in B) cells from different organs and TILs were determined at the late stage (day 24) of tumor development using flow cytometry analyses. The result of each dot shown is derived from an individual mouse. *p < 0.05 and **p < 0.01 with paired student’s t test. #p < 0.05 and ##p < 0.01, compared with the NK or NKT cells in blood from tumor-free mice analyzed by unpaired student’s t test. C, D Dynamic changes of CTLA4, PD1, and Tim3 in the TI-NK and TI-NKT cells in the E0771 tumor-bearing mice with the different time points after tumor challenge. Cell preparation and analyses were identical as described in (A) and (B). The result of each dot shown is derived from an individual mouse. *p < 0.05 and **p < 0.01 with unpaired student’s t test. E Dynamic changes of triple-positive cell population (PD1+CTLA4+Tim3+) in the TI-NK and TI-NKT cells in the tumor-bearing mice with the different time points after tumor challenge. Cell preparation and analyses were identical as described in (A) and (B). Data shown are mean ± SD from five mice in each time point. **p < 0.01, compared with the population in TI-NK cells in the same time point analyzed by unpaired student’s t test.
We next explored the status of antigen-specific NKT cells in the breast tumor-suppressive microenvironment. There are two types of NKT cells restricted by the CD1d molecule on the surface of antigen-presenting cells (APCs), type I and type II NKT cells. Type I NKT (invariant NKT, iNKT) cells respond to stimulation with glycosphingolipid α-galactosylceramide (α-GalCer) presented by CD1d [45]. We utilized the CD1d-PBS-57 (a-GalCer analog) tetramers to identify and analyze the phenotypes of iNKT cells in the E0771 tumor-bearing mice (Supplementary Fig. S2). We found that the fraction of iNKT cells in NKT cells were much higher in liver (above 50%) than that in other organs (around 20%). Furthermore, iNKT cell population was increased in the blood while decreased in the SPs and LNs in NKT cells of tumor-bearing mice compared with those in tumor-free mice. There was a small amount of iNKT cells in the tumor-infiltrating NKT cells in the tumor microenvironment (Fig. 5A). Unexpectedly, we found that iNKT cells express much lower levels of exhaustion markers CTLA4 and Tim3 compared with bulk NKT cells from different organs in both tumor-bearing mice and tumor-free mice (Fig. 5B). Furthermore, much lower levels of CTLA4, PD1 and Tim3 in the tumor-infiltrating iNKT cells were observed than those in the tumor-infiltrating bulk NKT cells in the tumor-bearing mice (Figs. 4B and 5B). In addition, significantly deceased expression of PD1 and Tim3 in iNKT cells in blood from tumor-bearing mice compared with tumor-free control mice (Fig. 5B). To determine the activating and inhibitory receptors in iNKT cells, we found that tumor-infiltrating iNKT cells highly expressed the activating receptors NKG2D and NKp46, suggesting fully activated iNKT cells in the tumor microenvironment (Fig. 5C). Furthermore, markedly increased NKG2D expression in iNKT cells from blood and livers and NKP46 expression in SPs, while decreased NKG2A expression in iNKT cells from livers and SPs, were observed in the tumor-bearing mice compared with those in tumor-free mice. In addition, unlike bulk NKT cells, tumor-infiltrating iNKT cells highly expressed granzme B (Fig. 5C). To determine the cytokine profile of iNKT cells in the tumor microenvironment, we observed that tumor-infiltrating iNKT cells produced low levels of IFN-γ, IL-4, and IL-10, but significantly secreted IL-17, suggesting that these iNKT cells might be critical for the induction of local inflammation in the tumor microenvironment (Fig. 5D). However, significant inhibition of IL-4 production in iNKT from LNs, IL-10 production in blood, and IL-17 production in blood and LNs were observed in tumor-bearing mice compared with those in tumor-free mice. These data indicate that glucolipid-specific iNKT cells are still active, which might be critical for anti-tumor immune response and a good candidate for tumor immunotherapy.
Fig. 5. iNKT cells have an activated state in the breast cancer tumor-bearing mice.

A The proportions of iNKT cells in different cell populations from different organs and TILs at the late stage of E0771 tumor development (day 24) were determined using flow cytometry analyses by gating CD3+CD1d-PBS-57 (tetramer)+ cells. Data shown are mean ± SD from 3–6 mice. *p < 0.05 and **p < 0.01 with paired or unpaired student’s t test. ##p < 0.01, compared with those in blood iNKT cells from tumor-free mice analyzed by unpaired student’s t test. B Expression levels of exhaustion markers CTLA4, PD1 and Tim3 in iNKT (gating CD3+CD1d-PBS-57+) cells from different organs and TILs were determined at day 24 of tumor development using flow cytometry analyses. Data shown are mean ± SD from 3–6 mice. *p < 0.05 and **p < 0.01 with unpaired student’s t test. #p < 0.05 and ##p < 0.01, compared with those in blood iNKT cells from tumor-free mice analyzed by unpaired student’s t test. C Expressions of the functional receptors and effector molecule in iNKT cells from different organs and TILs were determined at day 24 after tumor challenge using flow cytometry analyses. Cell assays and analyses were identical to (B). ND: not detected. *p < 0.05 and **p < 0.01 with unpaired student’s t test. ##p < 0.01, compared with those in iNKT cells in blood from tumor-free mice analyzed by unpaired student’s t test. D Cytokine profiles of iNKT cells in the breast cancer E0771 tumor-bearing mice. IFN-γ, IL-17, IL-4, and IL-10-producing iNKT cell populations from different organs and TILs were determined at day 24 after tumor challenge using flow cytometry analyses after stimulation with PMA and ionomycin for 5 h. Cell assays and analyses were identical to (B). *p < 0.05 and **p < 0.01 with unpaired student’s t test. ##p < 0.01, compared with the cytokine-producing iNKT cells in blood from tumor-free mice analyzed by unpaired student’s t test.
NK and NKT cells in B16 melanoma model exhibit similar phenotypic profiles with those in E0771 breast cancer
We next utilized the mouse B16F0 melanoma model to further validate whether NK and NKT cells have distinct phenotypes as shown in the mouse E0771 breast cancer model. We analyzed the proportions of NK in the different organs and tumors in the late stage during B16F0 development. Similar as shown in the breast cancer E0771 model, very low proportions of tumor-infiltrating NK cells were observed in the B16 melanoma-bearing mice. Furthermore, cell proportions of NK cells in LNs, SPs and livers in B16F0-bearing mice were decreased compared with those in tumor-free mice (Supplementary Fig. S3A). We also determined the NK activation and maturation statuses in the late stage of cancer development in this B16 melanoma model. Tumor-infiltrating NK cells in B16F0-bearing mice expressed high levels of inhibitory receptor NKG2A. However, the expression levels of activating receptors NKG2D and NKp46 were also high in the tumor-infiltrating NK cells (Supplementary Fig. S3B). Similar to E0771 breast cancer model, NK cells had increased immature populations (CD11b−CD27− and CD11b−CD27+) but decreased mature populations in the TILs and SPs in B16F0 tumor-bearing mice compared with NK cells in the peripheral organs in the tumor-free mice (Supplementary Fig. S3C). In addition, tumor-infiltrating NK cells in B16 melanoma showed high granzyme B expression but decreased IFN-γ production and perforin expression (Supplementary Fig. S3D). Notably, there were significant increases of granzyme B in NK cells from different organs in tumor-bearing at the late stage of tumor development compared with those in respective organs in tumor-free mice (Supplementary Fig. S3D). In parallel, expression levels of transcription factors EOMES and T-bet in NK cells were also decreased in the different organs and TILs in the B16F0-bearing mice compared with tumor-free mice (Supplementary Fig. S3E). Unlike NK cells in E0771 tumor-bearing mice, expression levels of exhaustion markers CTLA4, PD1, and Tim3 were moderate in the tumor-infiltrating NK cells in B16-bearing mice. In addition, increased expression of these molecules on NK cells in SPs in the tumor-bearing mice compared with tumor-free mice (Supplementary Fig. S3F).
The proportions of NKT in the different organs and tumor sites in the late stage of the B16F0 tumor-bearing mice were similar as shown in E0771 tumor-bearing mice with low levels. Furthermore, the populations of NKT cells in SPs and livers of tumor-bearing mice were decreased compared with those in tumor-free mice (Supplementary Fig. S4A). In addition, low levels of IFN-γ production and perforin expression but high level of granzyme B existed in the tumor-infiltrating NKT cells in the late stage of B16F0 tumor-bearing mice (Supplementary Fig. S4B). Furthermore, increased granzyme B expression in NKT cells from blood and livers, perforin expression in blood NKT cells, and decreased IFN-γ production in SP NKT cells in the B16F0 tumor-bearing mice compared with tumor-free mice (Supplementary Fig. S4B). In addition to low production of IFN-γ, tumor-infiltrating NKT cells produced low levels of IL-4, IL-10, and IL-17. Notably, increased IL-4 and IL-10 production in blood NKT cells and decreased IL-4 and IL-10 production in SP NKT cells in B16F0 tumor-bearing mice compared with the respective organs in tumor-free mice (Supplementary Fig. S4B). These results were consistent with the expression levels of the transcription factors EOMES, T-bet, GATA3, and RORγt in NKT cells in the different organs and TILs in the tumor-bearing mice (Supplementary Fig. S4C). Consistent with NKT cells in breast cancer E0771 tumor-bearing mice, high expression levels of CTLA4, PD1, and Tim3 in tumor-infiltrating NKT cells in B16F0 tumor-bearing mice. Significantly increased CTLA4, PD1 and Tim3 expression in SP NKT cells and CTLA4 and Tim3 expression in blood NKT cells were also observed in B16F0 tumor-tumor-bearing mice compared with those in the respective organs in tumor-free mice (Supplementary Fig. S4D). In addition, CTLA4, PD1, and Tim3 triple-positive cell populations in tumor-infiltrating NKT cells were much higher than those in tumor-infiltrating NK cells in the B16F0 tumor-bearing mice (Supplementary Fig. S4E). These results collectively suggest that NKT cells have more exhaustion phenotype than NK cells in the tumor microenvironment of melanoma, similar to those in breast cancer E0771 tumor-bearing mice.
NK cells in the tumor microenvironment are developing senescent cells
Our studies have clearly suggested that NK cells in breast cancer have impaired functions but are not exhausted cells. Our recent studies have shown that different types of tumor cells and Treg cells could induce T-cell senescence in the tumor microenvironment [37, 39–41]. Therefore we reasoned that NK cells might be senescent in the breast cancer E0771 tumor-bearing mice. We purified NK cells from blood, livers, and tumor tissues from E0771 tumor-bearing mice and determined cell senescence. We observed that markedly elevated SA-β-gal+ NK cells exist in blood, livers, and TILs derived from E0771 tumor-bearing mice but not in tumor-free mice (Fig. 6A). We then explored whether breast cancer cells can directly induce senescence and impaired functions in NK cells. We purified mouse NK cells from the SPs of normal healthy mice and then co-cultured with E0771 breast cancer cells. We found that significantly downregulated expression of effector molecules granzyme A and B, perforin and IFN-γ in NK cells after co-culture with E0771 cells (Fig. 6B). Furthermore, co-culture with E0771 cells also reduced the expression of activating receptors NKG2D and NKp46 in responder NK cells. However, E0771 treatment did not promote expression of exhaustion molecules PD1, CTLA4, and Tim3 in responder NK cells (Supplementary Fig. S5A). Consistent with the results of NK cells purified from the tumor-bearing mice; co-culture with E0771 breast cancer cells significantly induced SA-β-gal+ cell populations in responder NK cells (Fig. 6C). In addition, E0771 treatment promoted KLRG1 expression, a cell senescence marker that directly involves inhibition of NK function, in co-cultured NK cells (Supplementary Fig. S5A) [46]. To further support the assertion that tumor cells induce senescence in NK cells, we purified human NK cells from peripheral blood, and then cultured NK cells with human breast cancer MCF-7 tumor cells. We obtained very similar results as shown in mouse NK cells co-cultured with E0771 cells. MCF-7 treatment dramatically decreased expressions of granzme A and B, perforin and IFN-γ in co-cultured human NK cells (Fig. 6D). Furthermore, co-culture with MCF-7 cells markedly downregulated the effector molecule CD56 expression, but did not promote expression of the inhibitory molecules PD1, CTLA4, and Tim3 (Supplementary Fig. S5B). As expected, increased senescent populations were induced in human NK cells co-cultured with MCF-7 cells (Fig. 6E). In addition, co-culture with MCF-7 cells upregulated expression of senescence-associated molecules CD57 in human NK cells (Supplementary Fig. S5B)[41]. Notably, in our in vitro co-culture system, we found that high expression of CTLA4 and Tim3 in both mouse and human NK cells (Supplementary Fig. S5), suggesting temporary activation of NK cells induced by IL-15 and IL-2 in the culture condition [47]. In addition to breast cancer, we evaluated whether NK cells in melanoma develop senescent phenotypes. We observed the similar results as shown in E0771 tumor-bearing mice that significantly elevated SA-β-gal+ NK cells existed in blood, livers, and TILs derived from the B16F0 tumor-bearing mice compared with NK cells purified from tumor-free mice (Supplementary Fig. S6A). Furthermore, co-culture with human M628 melanoma cells decreased expressions of granzme B, perforin and IFN-γ in the co-cultured human NK cells (Supplementary Fig. S6B). In addition, increased senescent populations were induced in human NK cells co-cultured with M628 melanoma cells, suggesting that melanoma can also directly induce NK cell senescence (Supplementary Fig. S6C). All these studies collectively suggest that both melanoma and breast cancer cells promote NK cells to become senescent NK cells in vitro and in vivo in the tumor microenvironment.
Fig. 6. NK cells are senescent cells induced by tumor cells in the tumor-bearing mice.

A Significantly increased SA-β-gal+ cell populations in NK cells purified from different organs and TILs were induced in the E0771 tumor-bearing mice but not in tumor-free mice. When primary tumors reached 15–20 mm in diameters, NK cells (CD3−NK1.1+) were purified from different organs or tumors of the tumor-bearing mice using the FACS and stained for SA-β-gal. NK cells purified from tumor-free littermates served as controls. Right histogram data shown are mean ± SD of NK cells from five mice of each group. The SA-β-gal+ NK cells were indicated as dark blue granules by the arrows. Scale bar: 20 μm. **p < 0.01 compared with those in NK cells from tumor-free mice. ##p < 0.01, compared with the SA-β-Gal+ NK cells in blood from tumor-free mice analyzed by unpaired student’s t test. B Co-culture with breast tumor cells significantly decreased expressions of effector molecules and IFN-γ in mouse NK (mNK) cells. Purified mouse NK from spleens by negative selection microbeads were pre-activated with IL-15 and IL-2 overnight and then co-cultured with E0771 cells at a ratio of 1:1 for 6 h. The treated mNK cells were separated and cultured for additional 2 days. IFN-γ, perforin, Grzm A and Grzm B-producing mNK cell populations were determined using flow cytometry analyses after stimulation with PMA and ionomycin for 5 h. C E0771 cell treatment markedly increased SA-β-gal+ NK cell populations in mNK cells as described in (B). The treated mNK cells were then separated and stained for SA-β-gal after culture for additional 2 days. Data shown in the right are mean ± SD of mNK cells from three repeated experiments. The SA-β-gal+ mNK cells were indicated with dark blue granules by the arrows. Scale bar: 20 μm. **p < 0.01 compared with those in mNK cells without tumor cell treatment. D Co-culture with human breast tumor MCF-7 cells significantly decreased expressions of effector molecules and IFN-γ in human NK cells (hNK). Purified hNK cells from PBMCs with negative selection microbeads were pre-activated with IL-15 and IL-2 overnight and then co-cultured with MCF-7 cells at a ratio of 1:1 for 6 h. The treated hNK cells were separated and cultured for additional 2 days. IFN-γ, perforin, Grzm A and Grzm B-producing hNK cell populations were determined using flow cytometry analyses after stimulation with PMA and ionomycin for 5 h. E MCF-7 cell treatment markedly increased SA-β-gal+ NK cell populations in hNK cells. Cell treatment and culture condition were identical as in (D). The treated hNK cells were then separated and stained for SA-β-gal after culture for additional 2 days. Data shown are mean ± SD of hNK cells from 3 repeated experiments. The SA-β-gal+ hNK cells were identified with dark blue granules by the arrows. Scale bar: 20 μm. **p < 0.01 compared with those in hNK cells without tumor cell treatment. F MCF-7 cell treatment induced phosphorylated activation of DNA damage related molecules in hNK cells. Cell treatment and culture condition were identical as in (D). The treated hNK cells were separated and p-ATM, p-H2AX, p-CHK2, and p-53BP1 expressions were determined after culture for additional 2 days using the flow cytometry analyses. G Inhibition of cAMP signaling in tumor cells by specific pharmacological inhibitors significantly prevented NK cell senescence induced by breast tumor cells. Cytokine pre-activated mNK or hNK cells were co-cultured with breast cancer E0771 cells or MCF-7 cells pretreated with inhibitors 7-ddA (320 μM) or H89 (20 μM) for 1 day, respectively. The co-cultured hNK or mNK cells were then separated and stained for SA-β-gal after culture for additional 2 days. **p < 0.01 compared with NK cells in the medium. #p < 0.05 and ##p < 0.01 compared with NK cell and tumor co-culture group not treated with inhibitors.
Our previous studies have identified that induction of T-cell senescence mediated by tumor cells is involved in the nuclear kinase ataxia-telangiectasia mutated protein (ATM)-associated DNA damage response and tumor-derived endogenous cyclic adenosine monophosphate (cAMP) signaling [37]. To determine whether DNA damage response is also involved in induction of NK cell senescence, we found that both MCF-7 breast cancer and M628 melanoma tumor cells significantly induced phosphorylation of ATM and the key DNA damage response proteins, including ATM substrates H2A histone family member X (H2AX) and TP-53-binding protein 1 (53BP1), as well as the downstream target checkpoint kinase 2 (CHK2) in responder NK cells (Fig. 6F and Supplementary Fig. S6D). In addition, we purified mouse and human NK cells and then cultured with E0771 and MCF-7 cells pretreated with the specific cAMP pharmacological inhibitors 7-ddA and H89, respectively [37]. We observed that treatments with the cAMP pharmacological inhibitors significantly prevented the induction of senescence in both mouse and human NK cells induced by breast cancer tumor cells (Fig. 6G). These results clearly indicate that NK cells are senescent cells in breast cancer and melanoma, which are directly induced by cancer cells.
Senescent NK cells in the tumor microenvironment are metabolically active
Recent studies have demonstrated that metabolism states direct NK cell function [48, 49]. Glycolysis is required for NK cell activation and effective immune responses [48, 50]. Furthermore, metabolism also controls the molecular processes of NKT cells to respond to lipid antigens and subsequent functions [51–53]. We therefore determined how the metabolic alterations are linked to their unique functional states within the tumor microenvironment. We first investigated the metabolic profile of senescent NK cells in the tumor microenvironment. We purified NK cells from blood and tumor tissues from the breast cancer E0771 tumor-bearing mice and then characterized the key metabolic gene profiles involving both glucose and lipid metabolism using real-time quantitative PCR analyses [54]. Those molecules include glucose transporters 1 and 3 (Glut1 and Glut3), as well as glycolysis-related enzymes hexokinase 2 (HK2), glucose-6-phosphate isomerase (GPI), phosphofructokinase 1 (PFK1), triosephosphate isomerase 1 (TPI1), enolase 1 (ENO1), pyruvate kinase muscle 2 (PKM2) and lactate dehydrogenase A (LDHα). Furthermore, the genes of key enzymes related to both cholesterol synthesis, and fatty acid oxidation and synthesis were also included, such as 3-hydroxy-3-methyl-glutaryl-CoA reductase (HMGCR), 3-hydroxy-3-methylglutaryl-CoA synthase 1 (HMGCS1), squalene monooxygenase (SQLE), isopentenyl-diphosphate delta isomerase 1 (IDI1), carnitine palmitoyltransferase I (CPT-1), fatty acid synthase (FASN) and acetyl-CoA carboxylases 1 (ACC1). Our studies suggested that NK cells from the blood and tumor tissues have heightened glucose and lipid metabolism in the tumor-bearing mice compared with those from tumor-free mice, showing elevated expression levels of the metabolic genes (Fig. 7A, B). To further explore whether tumor cells can reprogram metabolism in NK cells, resulting in NK cell senescence, we purified NK cells from Peripheral blood mononuclear cells (PBMCs) of health donors and then activated with recombinant IL-2 and IL-15 for 24 h. The pre-activated human NK cells were co-cultured with MCF-7 breast cancer and M628 melanoma tumor cells, and then metabolic gene profiles involving glucose and lipid metabolism were determined [54]. We found that expression levels of the most glucose and lipid metabolism-related genes were increased in senescent NK cells induced by human MCF-7 breast cancer and M628 melanoma tumor cells (Fig. 7C, D and Supplementary Fig. S6E, F). To further confirm that senescent NK cells have high glucose metabolism, we determined the glucose uptake ability of senescent NK cells induced by both MCF-7 and M628 tumor cells, using a fluorescent glucose analog 2-[N-(7-nitrobenz-2-oxa-1,3-diazol-4-yl) amino]–2-deoxy-D-glucose (2-NBDG) labeling assay [54]. We observed that tumor-induced senescent NK cells had a high glucose uptake capacity (Fig. 7E and Supplementary Fig. S6G). Collectively, our studies suggest that NK cells are senescent cells with active glucose and lipid metabolism in melanoma and breast cancer.
Fig. 7. NK and NKT cells in breast cancer have different metabolic profiles.

A Gene expression of glucose transporters (Glut1 and Glut3) and the key enzymes in glycolysis (HK2, GPI, PFK1, TPI, ENO1, PKM2 and LDHα) in NK cells in blood and TILs at the late stage of E0771 tumor development (day 24). Total RNA was isolated from purified NK cells from E0771 tumor-bearing and tumor-free mice and analyzed by real-time qPCR. Expression levels of each gene were normalized to β-actin expression level and adjusted to the levels in blood NK cells in tumor-free mice (served as 1). Data shown are mean ± SD from at least five mice in each group. *p < 0.05 and **p < 0.01 compared with blood NK cells from tumor-free mice. #p < 0.05 and ##p < 0.01 compared with blood NK cells in tumor-bearing mice. B Gene expression of key enzymes in cholesterol synthesis (HMGCR, HMGCS1, SQLE, and IDI1), as well as fatty acid oxidation (CPT-1) and synthesis (ACC1 and FASN) in NK cells in blood and TILs at the late stage of mouse E0771 breast tumor development. Cell preparations and assays were identical to (A). *p < 0.05 and **p < 0.01 compared with blood NK cells from tumor-free mice. #p < 0.05 and ##p < 0.01 compared with blood NK cells in tumor-bearing mice. Gene expression of glucose transporters and the key enzymes in glycolysis (in C) and lipid metabolism (in D) in human NK cells co-cultured with breast cancer MCF-7 cells. Human NK (hNK) cells were purified from PBMCs and activated with rhIL-15 and rhIL-2 overnight. Activated hNK were co-cultured with MCF-7 cells at a ratio of 1:1 for 6 h. The treated hNK cells were separated and gene expression of glucose and lipid metabolism-related enzymes was evaluated using real-time qPCR. Expression levels of each gene were normalized to β-actin expression and then adjusted to the level in hNK cells in medium only. Data shown are mean ± SD from four individual healthy donors. *p < 0.05 and **p < 0.01, compared with hNK cells in medium only group. E MCF-7 tumor-treated hNK cells have a high glucose uptake capacity. Cell preparations were identical to (C) and (D). The treated hNK cells were separated and cultured for additional 2 days. The glucose uptake capacity in hNK cells was determined by the flow cytometry after addition of 2-NBDG. Results shown are a representative of NK cells obtained from three individual healthy donors. Gene expression of lipid metabolism (in F), as well as glucose transporters and the key enzymes in glycolysis (in G) in mNKT cells in blood and TILs at the late stage of E0771 breast tumor development. Cell preparations and assays were identical to (A) and (B). ND not detectable. *p < 0.05 and **p < 0.01 compared with blood NKT cells from tumor-free mice. #p < 0.05 and ##p < 0.01 compared with blood NKT cells in tumor-bearing mice.
We also determined the metabolic gene expression levels in NKT cells purified from the blood and tumor tissues in the breast tumor E0771 tumor-bearing mice (Fig. 7F, G). Unlike NK cells, NKT cells in blood or/and TILs from the tumor-bearing mice had significantly decreased Glut1, Glut3, ENO1, and PKM2 gene expressions compared with those of tumor-free mice. Furthermore, increased gene expression of TPI was observed in the tumor-infiltrating NKT cells. Notably, there were no obvious changes of other genes related to glycolysis between tumor-bearing mice and tumor-free mice. However, the genes of key enzymes (HMGCS1 and IDI1) related to cholesterol synthesis were significantly downregulated in NKT cells from both blood and tumor tissues of tumor-bearing mice but not tumor-free mice. In addition, little increases of FASN and SQLE expression were detected in tumor-infiltrating NKT cells but not NKT cells from blood in the tumor-bearing mice (Fig. 7F, G). These results clearly indicate that exhausted NKT cells have distinctly different metabolic profiles with senescent NK cells in the tumor-bearing hosts.
DISCUSSION
Dissecting the dynamics and functional roles of different subsets of immune cells in the tumour-suppressive microenvironment is challenging but critical for the development of effective anti-tumor immunotherapies. In the current study, we investigated both NK and NKT cells in tumors and multiple organs during the course of tumor development and progression in the breast cancer E0771 and melanoma B16F0 models. Our results suggested that both NK and NKT cells are dynamically involved in immune responses to cancers but have distinct distributions and phenotypic profiles. In the early stage of tumor development, both NK and NKT cells may perform immunosurveillance. However, in the late cancer stage, NK and NKT cells have impaired anti-tumor capacity but with distinct dysfunctional fates and metabolic profiles. NK cells develop into senescent cells, but NKT cells, except iNKT cells, are exhausted in advanced cancer. However, antigen-specific iNKT cells show an activated and effector state in the breast cancer. In addition, senescent NK cells, but not NKT cells, in the tumor microenvironment have active glucose and lipid metabolism. These studies are critical for a better understanding of the roles of NK and NKT cells in directing cancer progression and for the development of novel and effective anti-tumor immunotherapies.
The “cancer immunoediting” concept has precisely described how the host immune system dynamically interacts with tumor cells and its dual roles in tumor development and progression in general [55]. Therefore, a better understanding of the dynamic changes of different immune cell subsets within individual cancer type is critical for the development of effective cancer immunotherapeutic approaches. We have previously demonstrated that CD4+ and CD8+ T cells have opposing roles in breast cancer progression and outcomes and that CD8+ T cells are the key effector cell population mediating effective anti-tumor immunity and a better clinical outcome [43]. In the current study, we further explored dynamic roles of the two key innate cell subsets NK and NKT cells in the breast cancer E0771 tumor model. In the early stage of cancer development in E0771-bearing mice, both NK and NKT cells might perform anti-tumor immunity although they have different organ distributions and phenotypic profiles. We showed that both NK and NKT cells accumulate in the tumor sites, and that both cell populations and absolute numbers were significantly increased at the early and middle stages of tumor development. Furthermore, NK cells highly expressed granzyme B and produced IFN-γ, while NKT cells also markedly expressed perforin and increased IFN-γ production during the course of early tumor development. All these results suggest that NK and NKT cells are important cell populations for controlling tumor growth and progression [8]. However, in the late stages of tumor development in breast cancer, our studies showed that both NK and NKT cells are dysfunctional for anti-tumor immune responses with the following evidence [16, 22, 32]. First, significantly reduced cell fractions and cell numbers in different organs and tumors of both NK and NKT cells were observed in the advanced E0771 breast tumor stage. Second, both NK and NKT cells have dramatically deceased expression of effector molecules granzyme B and/or perforin, and reduced effector cytokine IFN-γ, resulting in impaired cytotoxic activities. In addition, consistent with previous studies from other groups, NK cells showed immature phenotypes with downregulation of activating receptors NKG2D and NKp46, as well as upregulation of inhibitory receptor NKG2A [22, 25–27]. Third, both NK and NKT cells developed dysfunctional states in the tumor-suppressive microenvironment. Our studies clearly indicated that NK cells become senescent cells and NKT cells show exhausted phenotypes in breast cancer. These results were further confirmed in the B16 melanoma model. Collectively, our current studies identify how tumor microenvironment dynamically shapes the functions and fates of NK and NKT cells in the course of tumor progression, which is important for the development of effective tumor immunotherapies targeting NK and NKT cells.
Our studies discovered that NK and NKT cells have distinct functional fates, senescence, and exhaustion, within the same tumor microenvironment. It is well-recognized that development of T-cell exhaustion is an important state of T-cell dysfunction induced by malignant tumors in patients with various types of cancer [56, 57]. In addition to exhaustion, T-cell senescence is the other important immune inhibiting effect in the tumor microenvironments from various types of cancer patients [34–36]. Our recent studies have further identified that both tumor cells and tumor-derived Treg cells can induce effector T cells to become senescent T cells [37–41]. Previous studies have suggested that tumor microenvironments reprogram NK cells to develop an exhausted state with increased PD1 expression and decreased expression of EOMES and T-bet [28, 29]. In our current studies, we unexpectedly found that NK cells recovered from breast cancer and melanoma are senescent cells rather than exhausted cells. To identify the mechanism responsible for NK cell senescence, we further showed that both breast cancer and melanoma tumor cells can directly induce NK cell senescence and dysfunction via tumor-derived cAMP, which is consistent with our previous studies in the senescence induction of effector T cells mediated by cancer cells [37]. Furthermore, we identified that competition of glucose between tumor cells and NK cells might be responsible for the NK cell senescence induced by tumor cells (data not shown). In addition, we found that tumor-associated Treg cells can induce senescence in NK cells besides different types of T cells (data not shown) [36, 54]. These results collectively indicate that NK cells are senescent in the tumor microenvironment.
Unlike NT cells, we identified that NKT cells, except for the iNKT subset, recovered from cancers display an exhausted state. Our current studies clearly demonstrated that tumor-infiltrating NKT cells develop increased exhaustion molecules but decreased effector molecules and cytokines during the course of tumor progression. Our studies have also discovered that different types of NKT cells show distinct functional fates in the tumor microenvironment. We utilized the CD1d-PBS-57 tetramer to identify and analyze the phenotypes of iNKT cells in the breast cancer E0771-bearing mice. Consistent with the other studies, the majority of iNKT cells exist in liver, but only small fractions of iNKT cells are in the peripheral organs and tumor tissues. Interestingly, iNKT cells show an activated and effector state in breast cancer, indicated by low expressions of exhaustion and inhibitory molecules, but high expressions of activating receptors and effector molecules and cytokines. These results are supported by the studies by other groups showing that type I NKT cells perform strongly protective effects against cancer, while type II NKT cells may have regulatory functions inhibiting tumor immunity [16, 18, 32]. Our future studies will continue to understand why and how the antigen-specific NKT cells escape the exhaustion and suppression mediated by the malignant tumor in the suppressive tumor microenvironment. Importantly, our novel findings from these studies provide critical information for the development of immunotherapies targeting NK and NKT cells in cancer patients. We should reconsider the functional states of NK and NKT cells in the individual cancer type of patients when using the in vitro and in vivo strategies to activate and expand NK and NKT cells for tumor immunotherapy. Furthermore, it is important to utilize strategies to prevent senescence and/or exhaustion in the transferred NK cells and NKT cells for the future cancer immunotherapy. In addition, screening and identification of effective glycolipid ligands to selectively activate iNKT cells is another potencial option for cancer immunotherapy.
Our current studies also raise another important issue: what are the metabolic profiles of NK and NKT cells in the tumour-suppressive microenvironment. It is now clear that cellular energy metabolism directs T-cell survival, proliferation, and the ability to perform specific and functional immune responses [58–60]. However, very limited information is known regarding how the metabolic processes affect cell development and functionality of NK and NKT cells [48, 53, 61, 62]. Recent studies have shown that aerobic glycolysis is specifically required for antigen presentation and effector functions for NK and NKT cells during viral infection [49, 51]. However, how the tumor microenvironment reprograms the metabolism of NK and NKT cells is unknown. Understanding the causative relationship between the metabolic processes and cell functional states during tumor development and progression will provide important information for the development of novel strategies for manipulating NK and NKT cell metabolism for tumor immunotherapy. Our current studies indicate that breast and melanoma tumor cells promote NK cells to become senescent cells. Furthermore, senescent NK cells in the tumor microenvironments have active glucose and lipid metabolism. This novel finding was supported by our recent studies showing that senescent T cells induced by Treg cells have increased glycolysis [41]. In contrast with NK cells, tumor-derived NKT cells have exhausted phenotypes and suppressed glucose metabolism. These studies not only define the distinct molecular and metabolic reprogramming events that control NK and NKT cell fates mediated by malignant tumors, but also provide novel and potential therapeutic strategies targeting NK and NKT cells for the treatment of cancer patients.
In summary, we report that NK and NKT cells have distinct distributions and phenotypic and metabolic profiles among organs and tumors during breast cancer and melanoma development and progression. We further identified that NK and NKT cells develop impaired functions but with different fates within the tumor microenvironment, and that NK cells become senescence but NKT cells display exhaustion. Our studies provide new insights relevant for the development of novel immunotherapeutic strategies utilizing NK and NKT cells to treat human cancers.
MATERIALS AND METHODS
Human blood samples and cell lines
Buffy coats from healthy donors of both adult men and women were obtained from the Gulf Coast Regional Blood Center at Houston. PBMCs were purified from buffy coats using Ficoll-Paque. Mouse NK (NK1.1+CD3−) and NKT (NK1.1+CD3+) cells were purified from different organs and tumor tissues by FACS sorting after staining with anti-mNK1.1-APC and anti-mCD3-Alexa Fluor 700 antibodies (purity ≥ 99%). In some co-culture studies, mouse NK cells were also purified with the negative selection kit (Stem Cell Technologies) and human NK cells were purified from PBMCs of healthy donors by the negative selection kit (Stem Cell Technologies). Human and mouse breast cancer MCF-7 and E0771 cell lines and mouse B16F0 melanoma cell line were purchased from the American Type Culture Collection (Manassas, VA). Melanoma M628 cells were obtained from the National Cancer Institute.
In vivo breast cancer tumor model
C57BL/6 mice were purchased from The Jackson Laboratory and maintained in the institutional animal facility. Female C57BL/6 mice with 6–8 weeks were used for the studies. All animal studies have been approved by the Institutional Animal Care Committee at Saint Louis University (Protocol No. 2411). Mouse breast tumor E0771 (2 × 10⁵) and melanoma tumor B16F0 (2 × 10⁵) cells in 100 μl of buffered saline were subcutaneously injected into the mammary fat pad and back of C57BL/6 mice, respectively. Five to ten mice were included in each group. Tumor volumes were measured every 3 days. When the tumor volumes reached the indicated sizes in diameters (5–8 mm, 10–12 mm, and 15–20 mm), the tumor-bearing mice were sacrificed. Blood, livers, LNs, SPs and tumor tissues were harvested and mononuclear cells were purified for subsequent NK and NKT cell purification, as well as their phenotypic and functional analyses. In addition, mononuclear cells from different organs of normal littermates were harvested and used as controls.
Flow cytometry analysis
The expression markers on mouse NK and NKT cells, or human NK cells were determined by FACS analyses after surface or intracellular staining with specific antibodies conjugated with Alexa Fluor 488, Alexa Fluor 647, Alexa Fluor 700, APC, Brilliant Violet 421™, FITC, Pacific Blue™, PE, PE/Cy7, PerCP-cy5.5, or PE/Dazzle™594. The mouse antibodies included: anti-CD3 (17A2), anti-NK1.1 (PK136), anti-NKG2D (C7), anti-NKG2A (16A11), anti-NKp46 (29A1.4), anti-CD11b (M1/70), anti-CD27 (LG.3A10), anti-CD69 (H1.2F3), anti-CD44 (IM7), anti-DX5 (HMα2), anti-PD1 (29F.1A12), anti-Tim3 (B8.2C12), anti-CTLA4 (UC10–4B9), anti-IFN-γ (XMG1.2), anti-IL-4 (11B11, BD), anti-IL-10 (JES5–16E3), anti-IL-17A (TC11–18H10.1), anti-granzyme B (GB11), anti-perforin (S16009A), anti-EOMES (Dan11mag), anti-T-bet (4B10), anti-GATA3 (16E10A23), anti-RORγt (Q31–378) and anti-FoxP3 (MF-14). Mouse CD1d-PBS-57 and control CD1d-unloaded tetramers were obtained from the Tetramer Core Facility of the National Institutes of Health (NIH). The human antibodies included: anti-granzyme A (CB9), anti-granzyme B (GB11), anti-perforin (dG9), anti-IFN-γ (4S.B3), anti-CD160 (BY55), anti-PD1 (EH12.2H7), anti-Tim-3 (F38–2E2), anti-CD56 (B159), anti-CD57 (HCD57), anti-CD27 (M-T271), anti-CD28 (CD28.2), anti-CTLA4 (BNI3), anti-phospho-ATM (Ser1981, #5883), anti-phospho-H2AX (Ser139/Tyr142, #5438), anti-phospho-CHK2 (Thr68, #2661), and anti-phospho-53BP1 (Ser25/29, #2674). All antibodies were purchased from Biolegend, BD Biosciences, eBioscience, or Cell Signaling Technology. For intracellular staining, cells were stimulated with PMA (50 ng/ml) and ionomycin (2 μg/ml) (Sigma-Aldrich, St. Louis, MO) for 5 h in the presence of GolgiStop™ (BD Biosciences). Cells were stained with antibodies for surface markers, and then permeabilized and fixed using Cytofix/Cytoperm buffer (BD Biosciences) or True-Nuclear™ Transcription Factor Buffer (BioLegend, San Diego, CA, USA) according to the manufacturer’s instructions. All stained cells were analyzed on an LSR II cytometer (BD Bioscience) and data analyzed with FlowJo software (Tree Star).
In vitro cytotoxicity assay
Cytotoxicity activity assay for NK and NKT cells was detected as described in the previous studies [63]. Calcein AM (final concentration 1 μM) was added to 106 target YAC-1 cells in 1 ml PBS and incubated at 37 °C in 5% CO2 for 30 min. Purified mouse NK and NKT cells were mixed with 1 × 10⁵ calcein AM-labeled YAC-1 target cells at variable effector: target (E:T) ratios in a final volume of 100 μl in 96-well round-bottom plates at 37 °C in 5% CO2 for 4 h. The labeled YAC-1 cells cultured in medium alone or with 0.1% Triton X (Sigma-Aldrich, St. Louis, MO) were included as a spontaneous release control or the maximal release control, respectively. After completion of incubation, plates were centrifuged at 300 × g for 5 min, and 100 μl of supernatant from each sample was transferred to a 96-well plate (Optiplate 96 F) and fluorescence was measured with a fluorometer at an excitation wavelength of 480 nm and emission wavelength of 538 nm. Each sample was determined in triplicated wells. Cytotoxicity was calculated based on the percentage of specific release of calcein using the following formula: % specific release = (experimental release – spontaneous release)/(maximum release – spontaneous release) × 100.
Senescence-associated β-Galactosidase staining
Senescence-associated β-Galactosidase (SA-β-Gal) activity in senescent NK cells was detected as we previously described [39–41]. Briefly, the purified mouse NK cells from blood, livers, SPs and tumor tissues of tumor-bearing and control tumor-free mice were directly stained with SA-β-Gal reagents (1 mg/ml X-Gal, 5 mM K3Fe[CN]6, 5 mM K4Fe[CN]6, 2 mM MgCl2 in PBS at pH 6.0). For in vitro co-culture studies, mouse or human NK cells were pre-activated with rhIL-15 (10 ng/ml) and rhIL-2 (500 IU/ml for mouse NK and 150 IU/ml for human NK cells) overnight. Activated mouse or human NK cells were co-cultured with or without mouse E0771 or human MCF-7 breast cancer and M628 melanoma tumor cells at a ratio of 1:1 for 6 h, respectively, and then separated and cultured for additional 2 days. The treated NK cells were prepared for SA-β-Gal staining. For some experiments, MCF-7 or E0771 tumor cells were pretreated with cAMP and PKA inhibitors 2′, 5′-Dideoxyadenosine (7ddA, 320 μM) and Dihydrochloride (H89, 20 μM) (Calbiochemistry, San Diego, CA) for 16 h [37]. The pre-activated NK cells were co-cultured with the inhibitor-treated tumor cells and then detected for SA-β-Gal expression in NK cells as described above.
Quantitative RT-PCR analysis
Total RNA was extracted from the mouse and human NK/NKT cells using the Trizol reagent (Invitrogen), and cDNA was transcribed using a SuperScript II RT kit (Invitrogen), both according to manufacturers’ instructions. Expression levels of each gene were determined by reverse-transcription PCR using specific primers, and mRNA levels in each sample were normalized to the relative quantity of β-actin gene expression. All experiments were performed in triplicate. The specific primers used for NK/NKT cells are listed in Supplementary Table 1. All primers were purchased from Integrated DNA Technologies.
Glucose uptake assay
Glucose uptake was determined following 15 min incubation of NK cells with a fluorescent d-glucose analog 2-[(7-nitrobenz-2-oxa-1,3-diazol-4-yl) amino]–2-deoxy-D-glucose (2-NBDG) (Cayman Chemical), as we previously described [54]. Activated human NK cells were co-cultured with or without MCF-7 or M628 at a ratio of 1:1 for 6 h and then were separated and cultured for additional 2 days. Treated and untreated NK cells were cultured in glucose-free medium for 30 min, and followed addition of 2-NBDG (100 μM) for 15 min and analyzed with a FACS Calibur flow cytometer (BD Bioscience).
Statistical analysis
Statistical analysis was performed with GraphPad Prism5 software. Unless indicated otherwise, data are expressed as mean ± standard deviation (SD). D’Agostino and Pearson test was used to test whether the data come from a Gaussian distribution. For multiple group comparison studies, the one-way analysis of variance was used, followed by the Dunnett’s test for comparing experimental groups against a single control. For single comparison between two groups, paired Student’s t test was used. Nonparametric t-test was chosen if the sample size was too small and not fit Gaussian distribution. The statistical parameters can be found in the figure legends.
Supplementary Material
Supplementary information The online version contains supplementary material available at https://doi.org/10.1038/s41388-021-01880-9.
ACKNOWLEDGEMENTS
The authors would like to thank Dr. Qingsheng Mi at the Henry Ford Health System to provide mouse CD1d-PBS-57 and control CD1d-unloaded tetramers for the studies. We also thank Joy Eslick and Sherri Koehm for FACS and analyses.
FUNDING
This work was partially supported by grants from the American Cancer Society (RSG-10-160-01-LIB, to GP), Melanoma Research Alliance (to GP), and the NIH (CA184379, CA242188, CA237149, and AG067441 to GP).
Footnotes
CONFLICT OF INTEREST
The authors declare no competing interests.
ETHICS APPROVAL
All the animal experiments have been approved by the Institutional Animal Care Committee in Saint Louis University (protocol No. 2411).
CONSENT FOR PUBLICATION
All authors agree with the submission.
DATA AVAILABILITY
All data presented in this study are included in this published article and the supplementary information files.
REFERENCES
- 1.Hu ZI, McArthur HL. Immunotherapy in breast cancer: the new frontier. Curr Breast Cancer Rep. 2018;10:35–40. [DOI] [PMC free article] [PubMed] [Google Scholar]
- 2.Polk A, Svane IM, Andersson M, Nielsen D. Checkpoint inhibitors in breast cancer—current status. Cancer Treat Rev. 2018;63:122–34. [DOI] [PubMed] [Google Scholar]
- 3.Lyons TG, Dickler MN, Comen EE. Checkpoint inhibitors in the treatment of breast cancer. Curr Oncol Rep. 2018;20:51. [DOI] [PubMed] [Google Scholar]
- 4.Gajewski TF, Fuertes M, Spaapen R, Zheng Y, Kline J. Molecular profiling to identify relevant immune resistance mechanisms in the tumor microenvironment. Curr Opin Immunol. 2011;23:286–92. [DOI] [PMC free article] [PubMed] [Google Scholar]
- 5.Baitsch L, Fuertes-Marraco SA, Legat A, Meyer C, Speiser DE. The three main stumbling blocks for anticancer T cells. Trends Immunol. 2012;33:364–72. [DOI] [PubMed] [Google Scholar]
- 6.Bates JP, Derakhshandeh R, Jones L, Webb TJ. Mechanisms of immune evasion in breast cancer. BMC Cancer. 2018;18:556. [DOI] [PMC free article] [PubMed] [Google Scholar]
- 7.Thommen DS, Schumacher TNT. Cell dysfunction in cancer. Cancer Cell. 2018;33:547–62. [DOI] [PMC free article] [PubMed] [Google Scholar]
- 8.Vivier E, Ugolini S, Blaise D, Chabannon C, Brossay L. Targeting natural killer cells and natural killer T cells in cancer. Nat Rev Immunol. 2012;12:239–52. [DOI] [PMC free article] [PubMed] [Google Scholar]
- 9.Yu J, Freud AG, Caligiuri MA. Location and cellular stages of natural killer cell development. Trends Immunol. 2013;34:573–82. [DOI] [PMC free article] [PubMed] [Google Scholar]
- 10.Bendelac A, Rivera MN, Park SH, Roark JH. Mouse CD1-specific NK1 T cells: development, specificity, and function. Annu Rev Immunol. 1997;15:535–62. [DOI] [PubMed] [Google Scholar]
- 11.Moretta L, Montaldo E, Vacca P, Del Zotto G, Moretta F, Merli P, et al. Human natural killer cells: origin, receptors, function, and clinical applications. Int Arch Allergy Immunol. 2014;164:253–64. [DOI] [PubMed] [Google Scholar]
- 12.Caligiuri MA. Human natural killer cells. Blood. 2008;112:461–9. [DOI] [PMC free article] [PubMed] [Google Scholar]
- 13.Chiossone L, Chaix J, Fuseri N, Roth C, Vivier E, Walzer T. Maturation of mouse NK cells is a 4-stage developmental program. Blood. 2009;113:5488–96. [DOI] [PubMed] [Google Scholar]
- 14.Fu B, Wang F, Sun R, Ling B, Tian Z, Wei H. CD11b and CD27 reflect distinct population and functional specialization in human natural killer cells. Immunology. 2011;133:350–9. [DOI] [PMC free article] [PubMed] [Google Scholar]
- 15.Kronenberg M, Gapin L. The unconventional lifestyle of NKT cells. Nat Rev Immunol. 2002;2:557–68. [DOI] [PubMed] [Google Scholar]
- 16.Terabe M, Berzofsky JA. The role of NKT cells in tumor immunity. Adv Cancer Res. 2008;101:277–348. [DOI] [PMC free article] [PubMed] [Google Scholar]
- 17.Mamessier E, Sylvain A, Thibult ML, Houvenaeghel G, Jacquemier J, Castellano R, et al. Human breast cancer cells enhance self tolerance by promoting evasion from NK cell antitumor immunity. J Clin Invest. 2011;121:3609–22. [DOI] [PMC free article] [PubMed] [Google Scholar]
- 18.O’konek JJ, Kato S, Takao S, Izhak L, Xia Z, Illarionov P, et al. beta-mannosylceramide activates type I natural killer t cells to induce tumor immunity without inducing long-term functional anergy. Clin Cancer Res. 2013;19:4404–11. [DOI] [PMC free article] [PubMed] [Google Scholar]
- 19.Motohashi S, Nagato K, Kunii N, Yamamoto H, Yamasaki K, Okita K, et al. A phase I-II study of alpha-galactosylceramide-pulsed IL-2/GM-CSF-cultured peripheral blood mononuclear cells in patients with advanced and recurrent non-small cell lung cancer. J Immunol. 2009;182:2492–501. [DOI] [PubMed] [Google Scholar]
- 20.Yamasaki K, Horiguchi S, Kurosaki M, Kunii N, Nagato K, Hanaoka H, et al. Induction of NKT cell-specific immune responses in cancer tissues after NKT cell-targeted adoptive immunotherapy. Clin Immunol. 2011;138:255–65. [DOI] [PubMed] [Google Scholar]
- 21.Smyth MJ, Thia KY, Street SE, Cretney E, Trapani JA, Taniguchi M, et al. Differential tumor surveillance by natural killer (NK) and NKT cells. J Exp Med. 2000;191:661–8. [DOI] [PMC free article] [PubMed] [Google Scholar]
- 22.Hasmim M, Messai Y, Ziani L, Thiery J, Bouhris JH, Noman MZ, et al. Critical role of tumor microenvironment in shaping NK cell functions: implication of hypoxic stress. Front Immunol. 2015;6:482. [DOI] [PMC free article] [PubMed] [Google Scholar]
- 23.Shifrin N, Raulet DH, Ardolino M. NK cell self tolerance, responsiveness and missing self recognition. Semin Immunol. 2014;26:138–44. [DOI] [PMC free article] [PubMed] [Google Scholar]
- 24.Ardolino M, Azimi CS, Iannello A, Trevino TN, Horan L, Zhang L, et al. Cytokine therapy reverses NK cell anergy in MHC-deficient tumors. J Clin Investig. 2014;124:4781–94. [DOI] [PMC free article] [PubMed] [Google Scholar]
- 25.Krneta T, Gillgrass A, Chew M, Ashkar AA. The breast tumor microenvironment alters the phenotype and function of natural killer cells. Cell Mol Immunol. 2016;13:628–39. [DOI] [PMC free article] [PubMed] [Google Scholar]
- 26.Pietra G, Manzini C, Rivara S, Vitale M, Cantoni C, Petretto A, et al. Melanoma cells inhibit natural killer cell function by modulating the expression of activating receptors and cytolytic activity. Cancer Res. 2012;72:1407–15. [DOI] [PubMed] [Google Scholar]
- 27.Groh V, Wu J, Yee C, Spies T. Tumour-derived soluble MIC ligands impair expression of NKG2D and T-cell activation. Nature. 2002;419:734–8. [DOI] [PubMed] [Google Scholar]
- 28.Gill S, Vasey AE, De Souza A, Baker J, Smith AT, Kohrt HE, et al. Rapid development of exhaustion and down-regulation of eomesodermin limit the antitumor activity of adoptively transferred murine natural killer cells. Blood. 2012;119:5758–68. [DOI] [PMC free article] [PubMed] [Google Scholar]
- 29.Liu Y, Cheng Y, Xu Y, Wang Z, Du X, Li C, et al. Increased expression of programmed cell death protein 1 on NK cells inhibits NK-cell-mediated anti-tumor function and indicates poor prognosis in digestive cancers. Oncogene. 2017;36:6143–53. [DOI] [PMC free article] [PubMed] [Google Scholar]
- 30.Hsu J, Hodgins JJ, Marathe M, Nicolai CJ, Bourgeois-Daigneault MC, Trevino TN, et al. Contribution of NK cells to immunotherapy mediated by PD-1/PD-L1 blockade. J Clin Investig. 2018;128:4654–68. [DOI] [PMC free article] [PubMed] [Google Scholar]
- 31.Sag D, Krause P, Hedrick CC, Kronenberg M, Wingender G. IL-10-producing NKT10 cells are a distinct regulatory invariant NKT cell subset. J Clin Investig. 2014;124:3725–40. [DOI] [PMC free article] [PubMed] [Google Scholar]
- 32.Izhak L, Ambrosino E, Kato S, Parish ST, O’konek JJ, Weber H, et al. Delicate balance among three types of T cells in concurrent regulation of tumor immunity. Cancer Res. 2013;73:1514–23. [DOI] [PMC free article] [PubMed] [Google Scholar]
- 33.McEwen-Smith RM, Salio M, Cerundolo V. The regulatory role of invariant NKT cells in tumor immunity. Cancer Immunol Res. 2015;3:425–35. [DOI] [PMC free article] [PubMed] [Google Scholar]
- 34.Schule JM, Bergkvist L, Hakansson L, Gustafsson B, Hakansson A. CD28 expression in sentinel node biopsies from breast cancer patients in comparison with CD3-zeta chain expression. J Transl Med. 2004;2:45. [DOI] [PMC free article] [PubMed] [Google Scholar]
- 35.Webb JR, Wick DA, Nielsen JS, Tran E, Milne K, McMurtrie E, et al. Profound elevation of CD8+ T cells expressing the intraepithelial lymphocyte marker CD103 (alphaE/beta7 Integrin) in high-grade serous ovarian cancer. Gynecologic Oncol. 2010;118:228–36. [DOI] [PubMed] [Google Scholar]
- 36.Liu X, Hoft DF, Peng G. Senescent T cells within suppressive tumor microenvironments: emerging target for tumor immunotherapy. J Clin Investig. 2020;130:1073–83. [DOI] [PMC free article] [PubMed] [Google Scholar]
- 37.Ye J, Ma C, Hsueh EC, Dou J, Mo W, Liu S, et al. TLR8 signaling enhances tumor immunity by preventing tumor-induced T-cell senescence. EMBO Mol Med. 2014;6:1294–311. [DOI] [PMC free article] [PubMed] [Google Scholar]
- 38.Ye J, Peng G. Controlling T cell senescence in the tumor microenvironment for tumor immunotherapy. Oncoimmunology. 2015;4:e994398. [DOI] [PMC free article] [PubMed] [Google Scholar]
- 39.Ye J, Huang X, Hsueh EC, Zhang Q, Ma C, Zhang Y, et al. Human regulatory T cells induce T-lymphocyte senescence. Blood. 2012;120:2021–31. [DOI] [PMC free article] [PubMed] [Google Scholar]
- 40.Ye J, Ma C, Hsueh EC, Eickhoff CS, Zhang Y, Varvares MA, et al. Tumor-derived gammadelta regulatory T cells suppress innate and adaptive immunity through the induction of immunosenescence. J Immunol. 2013;190:2403–14. [DOI] [PMC free article] [PubMed] [Google Scholar]
- 41.Liu X, Mo W, Ye J, Li L, Zhang Y, Hsueh EC, et al. Regulatory T cells trigger effector T cell DNA damage and senescence caused by metabolic competition. Nat Commun. 2018;9:249. [DOI] [PMC free article] [PubMed] [Google Scholar]
- 42.Zhao Y, Shao Q, Peng G. Exhaustion and senescence: two crucial dysfunctional states of T cells in the tumor microenvironment. Cell Mol Immunol. 2020;17:27–35. [DOI] [PMC free article] [PubMed] [Google Scholar]
- 43.Huang Y, Ma C, Zhang Q, Ye J, Wang F, Zhang Y, et al. CD4+ and CD8+ T cells have opposing roles in breast cancer progression and outcome. Oncotarget. 2015;6:17462–78. [DOI] [PMC free article] [PubMed] [Google Scholar]
- 44.Parekh VV, Wilson MT, Olivares-Villagómez D, Singh AK, Wu L, Wang CR, et al. Glycolipid antigen induces long-term natural killer T cell anergy in mice. J Clin Investig. 2005;115:2572–83. [DOI] [PMC free article] [PubMed] [Google Scholar]
- 45.Matsuda JL, Naidenko OV, Gapin L, Nakayama T, Taniguchi M, Wang CR, et al. Tracking the response of natural killer T cells to a glycolipid antigen using CD1d tetramers. J Exp Med. 2000;192:741–54. [DOI] [PMC free article] [PubMed] [Google Scholar]
- 46.Muller-Durovic B, Lanna A, Covre LP, Mills RS, Henson SM, Akbar AN. Killer cell lectin-like receptor G1 Inhibits NK cell function through activation of adenosine 5’-monophosphate-activated protein kinase. J Immunol. 2016;197:2891–9. [DOI] [PMC free article] [PubMed] [Google Scholar]
- 47.Stojanovic A, Fiegler N, Brunner-Weinzierl M, Cerwenka A. CTLA-4 is expressed by activated mouse NK cells and inhibits NK cell IFN-gamma production in response to mature dendritic cells. J Immunol. 2014;192:4184–91. [DOI] [PubMed] [Google Scholar]
- 48.Mah AY, Cooper MA. Metabolic regulation of natural killer cell IFN-gamma production. Crit Rev Immunol. 2016;36:131–47. [DOI] [PMC free article] [PubMed] [Google Scholar]
- 49.Mah AY, Rashidi A, Keppel MP, Saucier N, Moore EK, Alinger JB, et al. Glycolytic requirement for NK cell cytotoxicity and cytomegalovirus control. JCI Insight. 2017;2:2. [DOI] [PMC free article] [PubMed] [Google Scholar]
- 50.Keppel MP, Saucier N, Mah AY, Vogel TP, Cooper MA. Activation-specific metabolic requirements for NK Cell IFN-gamma production. J Immunol. 2015;194:1954–62. [DOI] [PMC free article] [PubMed] [Google Scholar]
- 51.Webb TJ, Carey GB, East JE, Sun W, Bollino DR, Kimball AS, et al. Alterations in cellular metabolism modulate CD1d-mediated NKT-cell responses. Pathog Dis. 2016;74:74. [DOI] [PMC free article] [PubMed] [Google Scholar]
- 52.Kim YH, Kumar A, Chang CH, Pyaram K. Reactive oxygen species regulate the inflammatory function of NKT cells through promyelocytic leukemia zinc finger. J Immunol. 2017;199:3478–87. [DOI] [PMC free article] [PubMed] [Google Scholar]
- 53.Ververs FA, Kalkhoven E, Van’t Land B, Boes M, Schipper HS. Immunometabolic activation of invariant natural killer T cells. Front Immunol. 2018;9:1192. [DOI] [PMC free article] [PubMed] [Google Scholar]
- 54.Li L, Liu X, Sanders KL, Edwards JL, Ye J, Si F, et al. TLR8-mediated metabolic control of human Treg function: a mechanistic target for cancer immunotherapy. Cell Metab. 2019;29:103–23. e105–123 [DOI] [PMC free article] [PubMed] [Google Scholar]
- 55.Schreiber RD, Old LJ, Smyth MJ. Cancer immunoediting: integrating immunity’s roles in cancer suppression and promotion. Science. 2011;331:1565–70. [DOI] [PubMed] [Google Scholar]
- 56.Baitsch L, Baumgaertner P, Devêvre E, Raghav SK, Legat A, Barba L, et al. Exhaustion of tumor-specific CD8(+) T cells in metastases from melanoma patients. J Clin Investig. 2011;121:2350–60. [DOI] [PMC free article] [PubMed] [Google Scholar]
- 57.Fourcade J, Sun Z, Benallaoua M, Guillaume P, Luescher IF, Sander C, et al. Upregulation of Tim-3 and PD-1 expression is associated with tumor antigen-specific CD8+ T cell dysfunction in melanoma patients. J Exp Med. 2010;207:2175–86. [DOI] [PMC free article] [PubMed] [Google Scholar]
- 58.Fox CJ, Hammerman PS, Thompson CB. Fuel feeds function: energy metabolism and the T-cell response. Nat Rev Immunol. 2005;5:844–52. [DOI] [PubMed] [Google Scholar]
- 59.MacIver NJ, Michalek RD, Rathmell JC. Metabolic regulation of T lymphocytes. Annu Rev Immunol. 2013;31:259–83. [DOI] [PMC free article] [PubMed] [Google Scholar]
- 60.Macintyre AN, Gerriets VA, Nichols AG, Michalek RD, Rudolph MC, Deoliveira D, et al. The glucose transporter Glut1 is selectively essential for CD4 T cell activation and effector function. Cell Metab. 2014;20:61–72. [DOI] [PMC free article] [PubMed] [Google Scholar]
- 61.Gardiner CM, Finlay DK. What fuels natural killers? Metabolism and NK cell responses. Front Immunol. 2017;8:367. [DOI] [PMC free article] [PubMed] [Google Scholar]
- 62.Kobayashi T, Mattarollo SR. Natural killer cell metabolism. Mol Immunol. 2019;115:3–11. [DOI] [PubMed] [Google Scholar]
- 63.Shin JH, Zhang L, Murillo-Sauca O, Kim J, Kohrt HE, Bui JD, et al. Modulation of natural killer cell antitumor activity by the aryl hydrocarbon receptor. Proc Natl Acad Sci USA. 2013;110:12391–6. [DOI] [PMC free article] [PubMed] [Google Scholar]
Associated Data
This section collects any data citations, data availability statements, or supplementary materials included in this article.
Supplementary Materials
Data Availability Statement
All data presented in this study are included in this published article and the supplementary information files.