
Fig. 4. Confirmation of macroarray data by Northern blot analysis.
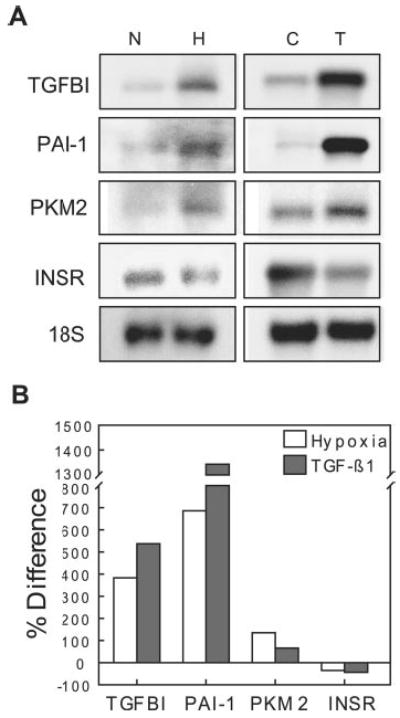
A, Northern blot analysis was performed on selected genes that were shown to be altered by hypoxia (H; 2% O2 for 48 h) versus normoxia (N) or TGF-β1 (T) (1 ng/ml for 48 h) versus the vehicle control (C) in macroarrays. B, expression levels are presented as the percent difference of band density for hypoxia versus normoxia or for TGF-β1-treated versus the vehicle control after normalization to 18 S ribosomal RNA.