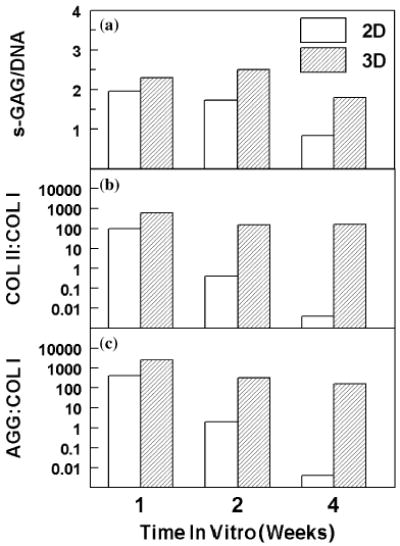
Figure 1.

Effect of 2D (monolayer) or 3D (porous collagen sponge) conditions on phenotype of bovine articular chondrocytes cultured for 1, 2, and 4 weeks. (a) Total sulfated glycosaminoglycan content (s-GAG) was measured by DMB assay and normalized to DNA content in each dish or sponge (n = 5). (b) Ratio of collagen type II (COL II) to collagen type I (COL I) was calculated from levels of each RNA as measured by quantitative, competitive RT-PCR assays and normalized to glyceraldehyde 3-phosphate dehydrogenase (G3PDH). (c) Ratio of aggrecan (AGG) to collagen type I (COL I) was calculated from levels of each RNA as measured by quantitative, competitive RT-PCR and normalized to G3PDH.
