
Figure 2.
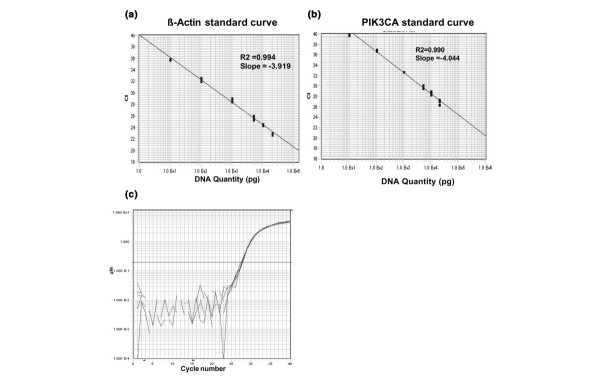
Typical real-time PCR curves generated for a cell line, a tumor, and normal tissue. Typical standard curves generated for (a) β-actin and (b) PIK3CA using serial diluted DNA from cell line MCF12A. (c) Representative real-time PCR curves for β-actin, generated using paired normal and tumor DNA from breast tissue of one individual. Each experiment was performed in triplicate and is shown by overlapping amplification curves. ΔRn = (Rn+) - (Rn-), where Rn+ is the fluorescence emission intensity of reporter/emission intensity of quencher at any time point, and Rn- is the initial emission intensity of reporter/emission intensity of quencher in the same reaction vessel before PCR amplification was initiated. Ct, cycle threshold.