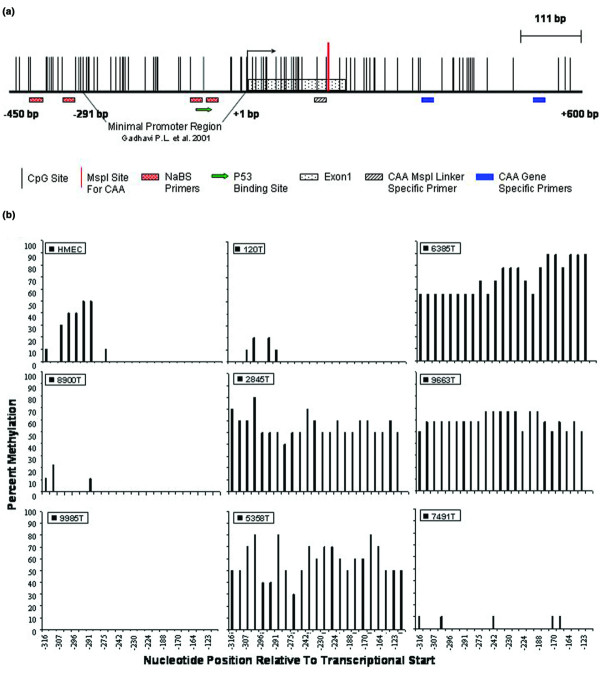
Figure 2.

The DSC3 promoter is aberrantly methylated in primary breast tumor samples. (a) Diagram of the DSC3 promoter region analyzed (with the minimal promoter region demarcated as described in [36]). (b) Summary of 5-methylcytosine levels obtained by sodium bisulfite genomic sequencing of the DSC3 promoter. Ten to twelve cloned PCR products were sequenced to determine the percent methylation of the 24 CpG sites in the region analyzed. Cytosine methylation frequency histograms are shown for normal HMECs and eight primary tumor specimens. The y-axis is percent cytosine methylation and the x-axis is the nucleotide position relative to the transcription start site.
